Optimize your Fishing
SportFishing is not just about casting a line randomly into the open sea. To maximize your chances, it is essential to understand and analyze oceanographic conditions. With the new SportFishing Ocean-O service integrated into TZ iBoat, you can now utilize data such as surface temperature, altimetry (SSH), and chlorophyll concentration to identify the most promising areas.
| This article presents a simple and structured method for interpreting this information and refining your fishing strategy. Using a real case study in the Gulf of Mexico, we will see how to combine these data to identify the best fishing spots. Whether you're a beginner or an experienced angler, this approach will give you the keys to making the most of oceanographic tools and optimizing your trips at sea. |  |
Identify the main areas using SSH
Start by displaying the SSH (Sea Surface Height), which represents the sea’s altimetry, to get an initial global view of the situation and identify the major oceanic structures.
Next, locate the areas where deep, colder water rises to the surface (Upwelling) and those where surface water sinks to deeper layers (Downwelling). These movements appear as concentric circles, with Upwelling associated with lower SSH and Downwelling corresponding to higher SSH.
These areas themselves are not necessarily the best fishing spots; the real interest lies at their boundaries, where the differences in conditions are most pronounced. The identified areas serve as a useful starting point for further refining the search.
![]()

General display of SSH (Altimetry) with contour lines.
Identify the areas where the SSH lines are very close together and locate the more open spaces between them, as these less dense transitions are the most favorable for fishing.
By identifying the different areas observed earlier, we can define these patterns:

Refine your search using currents
Display the currents layer and first identify the areas of strong currents, clearly visible thanks to the large arrows that draw river-like patterns in the middle of the ocean.
Strong currents are not the most favorable areas for fishing. The anomalies along the edges of these currents, where small whirlpools (less than 10 km in diameter) called Eddies form, are more important. These Eddies trap and redistribute nutrients as well as plankton biomass, thus promoting the presence of the targeted species. There is a huge dynamic within these small structures.
Eddies are small whirlpools driven by weak currents. They can form a complete circle or just a simple curve, sometimes at a right angle.
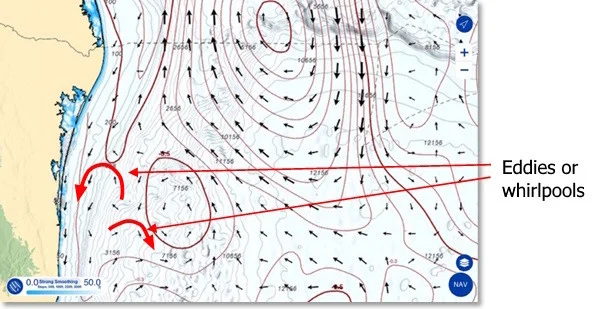
In this screenshot, the currents are represented by arrows and the SSH by contours.
| You can also identify areas where currents converge. These areas play a key role in ocean dynamics as they promote the accumulation of nutrients and plankton biomass. These regions create favorable conditions for phytoplankton development, which in turn attracts marine species in search of food. |  |
Note: It is sometimes possible to establish a correlation between Eddies and bathymetry, as the seabed can enhance the upwelling effect. When this happens, the area found becomes even more interesting for further exploration.
Refine your search using the SST
Now, display the SST (Sea Surface Temperature) layer and look for the "fronts," which represent abrupt temperature changes and mark the meeting of two temperature masses. These fronts are crucial because they act as "barriers" for fish. Most pelagic fish prefer to stay in the warm water zone and only cross this "barrier" (warm water/cold water) to feed or hunt.

The SST is displayed in colors and contours to better highlight the fronts.
To highlight these fronts, you can use the color display, where you look for abrupt color changes, or the contour line display, where you focus on areas where the contours become closer together. Displaying both at the same time can be a good idea to maximize your chances of finding the fronts!

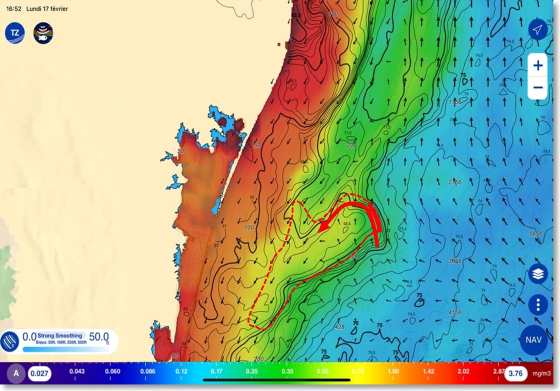
The current is represented by arrows above the SST, which is shown in colors.
Do you remember the Eddies observed earlier? Display the currents again and overlay them with the SST. Do you notice a clear boundary between the warmer and colder waters at the Eddies? If so, this indicates an area where an SST front meets a vortex, making it particularly interesting.
Cross with Chlorophyll
Areas with high chlorophyll concentration correspond to turbid waters rich in phytoplankton, which often attract fish. In contrast, low chlorophyll concentration indicates clearer waters, less favorable to plankton and fish presence. To refine your search, target chlorophyll patches in the middle of clearer waters.
The most interesting areas are found at the borders of these patches, where phytoplankton concentrates. To maximize visibility of these areas, switch to manual mode and adjust the minimum and maximum chlorophyll values. This will increase the color contrast on your screen, making the areas of interest easier to identify.

Chlorophyll is represented by colors and contours, while currents are shown by arrows.
Note: There is often a strong correlation between SST fronts and high chlorophyll concentrations.
Display SST (colors), Chlorophyll (contours) and currents
To summarize the different observations made earlier, let's see if we can find an area that "matches" well with the various data.
The chlorophyll colors, the SST contours, and the current arrows.
Conclusion
To sum up, several key elements help find the best fishing spots. The combination of these different factors will guide you. To analyze them, we use the different layers available in SportFishing Ocean-O.
First, it is essential to identify areas where SSH lines are more spaced out, as these specific locations offer better conditions for fishing.
Then, look for sea surface temperature (SST) fronts, especially those linked to eddies (small ocean whirlpools), because these dynamic structures influence the movement of nutrients and phytoplankton. Finally, search for small chlorophyll patches and check where they meet clear waters these transition zones can indicate areas of high biological activity.
By combining these elements, you will greatly improve your chances of having an amazing fishing trip!