Adjusting Vector Chart display
Unlike Raster charts, Vector charts provide control over the level of information displayed and how it is rendered on screen. Vector charts are made up of individual objects and data layers such as navigational aids, spot soundings, and land features that can be displayed, hidden and represented in various ways.
TZ iBoat includes a vector chart rendering engine that has been tuned to mimic the traditional paper chart display while keeping all of the great features of vector data. Because different users have different needs and preferences, TZ iBoat includes lots of adjustments that can be made from the Vector Chart settings.
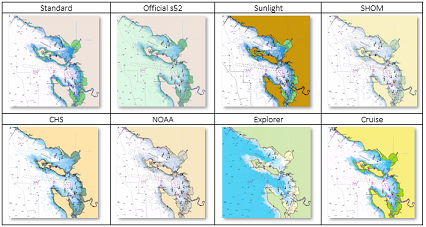
Color Theme
TZ iBoat offers various color themes that match the color palettes of the main Hydrographic Office around the world. All color palettes use a white background to signify deep water and blue to signify shallow water, except for the "Explorer" palette which adopts a reverse shading. Make sure to try all these color themes to pick the one that is best suited to your taste:
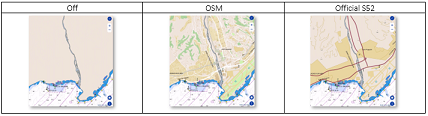
Land Features
Land features can be turned OFF all together, or can be sourced from either the official vector data ("Official S-52") or from Open Street Map ("OSM").
Open Street Map offers the greatest amount of details on land (especially for roads and buildings), but you may decide to use "Official S-52" if you prefer land areas to be less dense on screen:
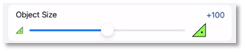
Object Size
"Chart Object Size" is a slider that allows you to change the size of the depth sounding, text and object icons (buoys, wrecks, obstructions, etc...). Some users may prefer larger icons and text while other would prefer a smaller size to declutter the screen:
Safety Depths
The “Shallow Contour”, “Safety Contour” and “Deep Contour” are used to color the various depth areas on the vector chart. The transition between colors is based upon the depth contour lines of the vector chart. If no contour line (corresponding to the exact value you selected) is available on the vector charts, the color transition will happen at the next (deeper) contour line available.
You should spend some times adjusting those settings to your liking as they have the greatest impact on "chart contrast".
Lights
The lights are displayed by default using a traditional "Simple Sectors" representation, but we would encourage you to use the new dynamic modes. If you would like more information about these new modes that are especially useful for night navigation, please refer to the Dynamic Lights chapter.