Displaying Tides and Currents on the Chart
TZ iBoat can predict the tide level and tidal currents direction/strength for thousands of tide stations around the world. To display tides and currents on the chart, tap on the "Layer" button located on the bottom right of your screen and select "Tidal Heights Stations" and/or “Tidal Currents”.
The tide icons displayed on the chart are dynamic and show you a preview of the water level:
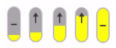
Rising from low to high
Falling from high to low

At slack (low and high)
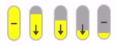
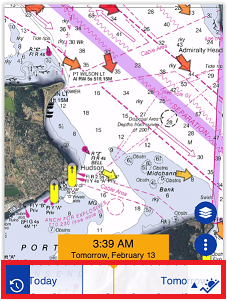
Tidal Currents will change direction, color, and size according to the current direction and strength:
![]()
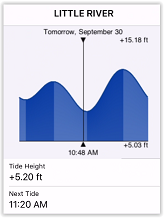
If you tap on a tide icon, a Pop-Up menu with a small tide graph will appear:
TIP: If you are looking for a specific tide station, you can search for it by tapping on the "Smart Search" button on the right of "TZ" button located on the top left of your screen, selecting "List and Search" and "Tide Station". A list with all the tides will be displayed. You can sort this list by range (distance from your boat) or type a name.
If you tap on "Open Tide Graph" button you will access to the screen "Tide", the time bar appears at the bottom of the screen allowing you to animate the Tide Graph by moving the time bar. You can also choose a specific date by selecting it using the “Calendar” button at the top left of the screen (2):
Note: If the timeline at the bottom of the screen is paused (displaying the device's current date and time), the tides and tidal currents context menu displays all real-time information. If the timeline is activated and moved (displaying past or future), the tides and tidal currents context menu populates the information for the date and time selected in the timeline.
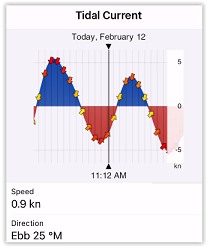
If you tap on a tidal current icon on the chart, a Pop-Up menu with a small current graph will appear: