Boundaries
TZ iBoat allows for the creation of up to 100 Boundaries (Areas, Lines and Circles) with up to 50 points per Area or Lines.
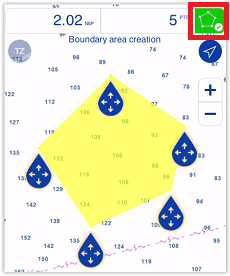
To create a boundary, tap on the chart at the location you want the boundary to start and select “New Boundary” from the Pop-Up menu. A second menu will appear allowing you to select the type of boundary you want to create (Area, Circle or Line). For areas and lines, tap on the chart to create boundary points. While you are in boundary building mode, you can move all boundary corners by using the handle below each point. When you are done click on the boundary validation button in the header:

TIP: You can also create a boundary area or boundary line by entering a succession of coordinates. Tap on the “TZ” button located on the top left of your screen, select “Add by Lat/Lon” from the Quick Actions and then select “Add Boundary by Lat/Lon”. This will display a dedicated Lat/Lon keyboard that will allow you to create the boundary points using their coordinates. Simply enter the coordinate of the first point, then tap on “Add Point #1”. Repeat the process with all points that constitute the boundary. When you are done, tap on “Done”.
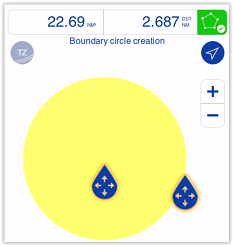
When you create a boundary circle, TZ iBoat will automatically create two handles that will allow you to move the center of the circle and another handle that will allow you to set the circle radius:

To change a boundary property (such as its color or pattern) tap on the boundary and select “Boundary Color” or “Pattern” from the Pop-Up menu.
If you wish to edit the boundary (move a point, add a point …) tap on the boundary and select “Edit Points”.
TIP: To be able to see the pop-up menu of the boundary, make sure that the entire boundary is visible on screen. Then, tap on it and select “Edit Points”.
This will enable the boundary creation mode allowing you to move each point using the handles. If you want to insert a new point (for boundary line or boundary area), tap on the leg of the boundary where you want to insert a point and then drag it to move it to the desired location.
To delete a boundary point, zoom on it until it becomes visible (small dot). Tap on it and select “Delete Point”.
All boundaries can be displayed or hidden on the chart by tapping the “Layer” button located on the bottom right and enabling or disabling the “Boundaries” button under “User Data”.