Creating & Editing Boundaries
Creating Boundaries graphically
TimeZero allows for the creation of up to 100 Boundaries (Areas, Lines and Circles) with up to 50 points per Area/Lines.
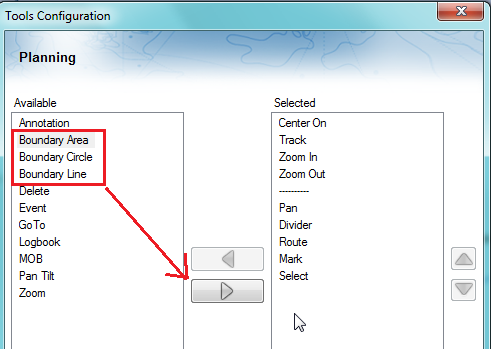
If the tools are not displayed, click on the "Configure Tools" button (at the lower end of the Toolbar) to add the tool you want to appear:
Click on the corresponding Boundary Tool (Area, Circle or Line) and click on the Chart to create the boundary. For areas and lines, double click on the last point to close the area or end the line.
You can also right click anywhere on the Chart and choose "Create" -> "Boundary".
The default color and transparency (for areas and circles) defined in the Marks & Boundaries options will be used.
Tips: You can right click on the Boundary Tools to select a color before creating the boundary on the chart.
Creating Boundaries (Areas and Lines) Manually
To create an area or a line manually by entering numbers (by Latitude/Longitude), double click on the corresponding Boundary Tool located in the Toolbar. This will display a window to enter the Latitude/Longitude numerically.
Delete or Rename Boundary
You can delete or rename a boundary by right clicking on the boundary edge and choosing the corresponding option from the drop down menu.
Note: Instead of clicking on the edge of a boundary, you can also select the boundary first (left click) and then right click on it. Just make sure that the boundary is displayed entirely on the screen. If the boundary is partially displayed (because the screen is zoomed in too much), you will not be able to select it. In this case, zoom out until the boundary is displayed entirely on the screen then click on it again to select it.
Moving a Boundary
To move a boundary, you have to select it first by left clicking on it with your cursor. Once selected, you can drag it to the new desired location. Just make sure that the boundary is displayed entirely on the screen. If the boundary is partially displayed (because the screen is zoomed in too much), you will not be able to select it. In this case, zoom out until the boundary is displayed entirely on the screen then click on it again to select it, then drag it.
If you want to manually adjust a boundary point coordinates (using lat/lon numbers), select the boundary first. The corners will appear, and you will be able to right click on them to edit their positions. Enter the new coordinates in the corresponding fields.
Note: if the boundary is locked, the corner will not appear. You will have to unlock the boundary first.
To move a circle by entering new coordinates, double click to display its Property window.
Changing Boundaries Color and Contour
Double click on a boundary (or right click and choose "Boundary Properties") to display the Property window. Change the color and/or contour from the corresponding fields.
Tips: If you want to assign the same color to multiple boundaries, use the "Select" tool to select multiple boundaries then right click on one of the selected boundaries.
Changing Boundary Area and Circle transparency
Double click on a circle or area (or right click and choose "Boundary Properties") to display the Property window. Change the transparency from the corresponding field.
Adjusting Boundary Contour Thickness
The Boundary Contour Thickness is a global setting (found under the Marks & Boundaries Options) that will affect all boundaries displayed on the screen.
Lock and Unlock Boundary
Right click on a boundary and choose "Lock Boundary" to lock a boundary. When a boundary is locked, you will not be able to move it or delete it (a dialog box will appear if you try to erase it). Use the same process to unlock a boundary.
Hiding Boundaries
All boundaries can be hidden by deselecting "Display boundaries" from the "Layer" Button (under the "User Data" category).