FSLE
What is FSLE
FSLE is an exclusive data available with the Premium Ocean-O Service geared towards commercial fishermen and advanced sport fishermen who want to target the best potential fishing spots. Unlike traditional data types that directly observe or predict specific variables like temperature, currents, or chlorophyll, FSLE provides insights into dynamic behaviors. FSLE is derived from ocean currents but highlights areas where “stretching” or “convergence” occurs. It helps detect oceanic fronts where water masses converge or concentrate. These fronts are aggregation zones for plankton and small fish, attracting the predators you’re targeting (tuna, swordfish, mackerel, etc.) Simply said, FSLE shows directly where the nutrients converge, and where the water separates:
To compute it, we simulate the movement of an infinite number of small floating objects (e.g., tiny balls) on the ocean's surface. This helps us determine where these objects would go—whether they follow a stable trajectory, diverge, or converge. The animation below illustrates this process, showing an example of particle advection by surface currents. Red particles remain on the same side of the front, while black particles cross the front:
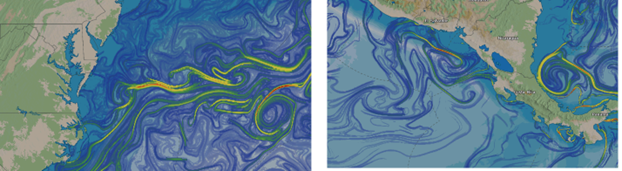
Our algorithm analyzes this behavior globally, using six months of historical geostrophic current data updated daily, to generate the image below with a 3 km resolution:
Note: FSLE is not affected by cloud cover, making it advantageous compared to SST or chlorophyll observations under cloudy conditions.
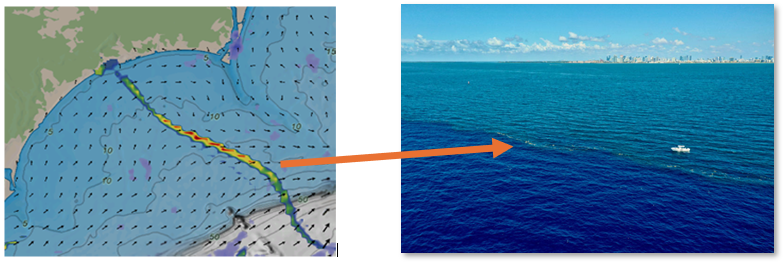
High FSLE values pinpoint areas where currents cause significant stretching. These values are typically arranged in intricate filaments. FSLE ridges often align closely with concentration of biogeochemical tracers, such as chlorophyll, plankton, and weed line. FSLE is a game changer as it directly points to where to go.
Thanks to the Ocean-O WorkSpace in TZ Professional, it is easy to display FSLE and combine it with other types of data. For example, FSLE fronts near temperature variations are often more productive, so it makes sense to display both FLSE and SST at the same time:

Chlorophyll may also be interesting to combine as FSLE fronts on the edge of plankton-rich zones are transit points for predators.
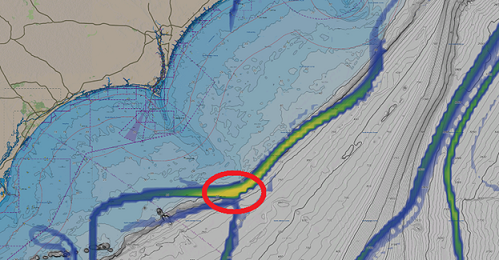
Another strong advantage of TZ Professional is to be able to display accurate bathymetry data thanks to the TZ MAPS BathyVision. When the convergence zones identified by the FSLE overlap with bathymetric drop-offs, oceanic and biological phenomena are often amplified. This creates areas of increased nutrient and organism concentration. For example, in the picture below, we can observe a strong convergence band aligning with the drop-off of the continental shelf.
In summary, the best fishing zones are often where FSLE fronts intersect with other breaks, such as temperature changes, chlorophyll concentrations, or relief changes (bathymetry).
TIPS: Using the “Keep data history” found in the Weather Options, you can record and replay the evolution of FSLE over the past days. Watching how FSLE filaments move is very interesting and helps predict their position in the coming days.