User Object Lists
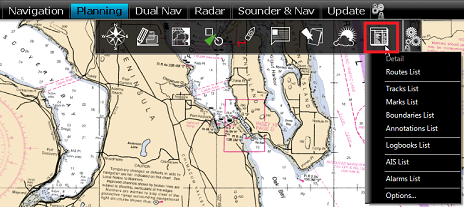
Lists are really useful to sort, filter and find specific objects. When you select a line from a list, the corresponding object gets selected on the chart and centered on the screen. To display a list of Marks, Boundaries or Annotations, click on the "List" button in the ribbon (displayed by default in the "Planning" WorkSpace).
Once the list tab is open at the bottom of the screen, you can change list category from the left pane:
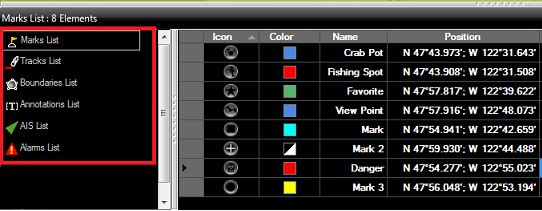
Note: The list for a corresponding object will only appear if you have created at least one object of that kind. So for example, if you have not yet created any mark, the mark list will not be available.
To select a specific row (or line), click inside the first grey column in front of the specific line:
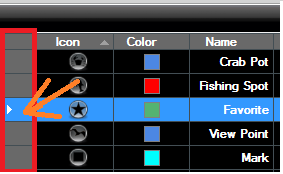
When a line is selected, the chart will be centered on the corresponding object.
The information displayed in the table (rows) can be customized by clicking on the "Action" button (available on the right side of the List header) and choosing "Configure List".
This information can be exported in a file (text format) or copied to the clipboard by clicking on the corresponding item under the "Action" menu. The fields in the text file are delimited using Tabs. We recommend using Windows Excel to open the file or paste the content of the clipboard (for proper formatting).
The "Filter" button (available on the right side of the List header) allows you to filter objects displayed in the list using various criteria. Once the list is filtered, select an object to center the chart on it (this is particularly useful to retrieve Marks created at a specific date).
Note: The filters do not affect what is displayed on the chart. The filters only affect what is displayed inside the list.