Polar
The "Routing Module" needs to be unlocked to access this feature
Opening a Polar file
Boat speed used by the Routing algorithm and Laylines is entered into TimeZero from a polar curve diagram which relates boat speed to wind speed at a given wind angle. To open a polar file, click on the TIMEZERO button located on the top left of the screen and select "Open Polar File". Click on the "Browse" button in front of "Wind Polar File":
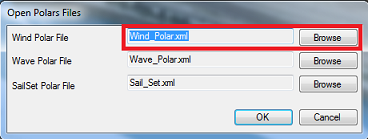
Select the polar file and click on "Open".
Note that various Wind Polar files for multiple sailing boats can be downloaded from www.mytimezero.com. Just click on "My TIMEZERO". sign in, click on "My PC Software" and then "Polars".
Note: You should not have to open any Wave_Polar file. The default Wave Polar file loaded in TimeZero should work for every user (as it applies an automatic relative offset to the Wind Polar).
The polar Graph
The polar file loaded in the software can be viewed and modified from the "Polar" WorkSpace:
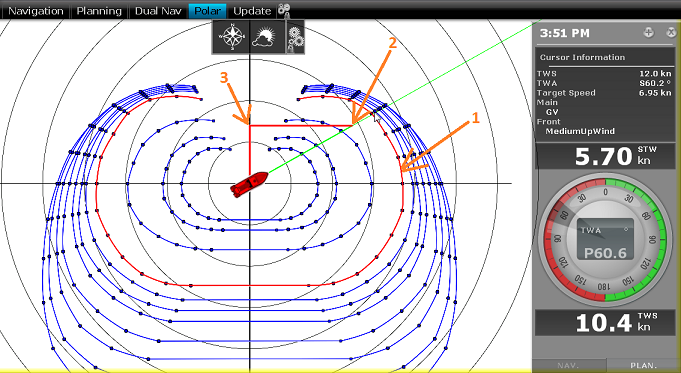
The various polar curves (in blue) represent the boat theoretical speeds according to True Wind Angle (TWA) and True Wind Speed (TWS). The theoretical boat speed value is given by the distance in between the point on the polar curve and the center of the graph (the farther away the greater the speed). There is one polar curve per True Wind Speed value. If TimeZero is connected to a sensor that output True Wind Speed, the polar curve corresponding to the real time wind speed ("Live Polar") will be highlighted in red (1).
Note: The graph can be either displayed in "Wind Up" (default) or "Head Up" from the "Mode" button located in the Ribbon. The traditional "Wind Up" display places the wind axis vertically on the graph.
If TimeZero is connected to a speed sensor (Speed Through Water), the real time boat speed will be displayed (2) with its projection on the wind axis (3) (aka: VMG).
In the Polar WorkSpace, the Cursor Information NavData gives various information related to the polar. In the example above, the cursor has been placed over the real time polar curve (displayed in red) in the boat direction (aligned with the heading line). We can learn that the Target Speed (theoretical boat speed) is 6.95Kn. The real time boat speed (STW) is only 5.70Kn . So, in this case, the boat is not reaching maximum performance (90% performance). This is either because the polar data over estimates the boat performances or because the sail configuration needs to be adjusted by the crew to meet the real boat performance.
Polar Performance analysis
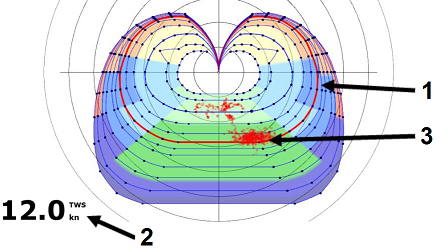
TimeZero continuously records wind and boat speed data at a rate of one sample per second. These samples can be displayed in the Polar WorkSpace as individual dots which, when accumulated, form a cloud o points called the Performance Plots. Performance Plots are automatically sorted by wind speed. In live mode, the wind speed sensor connected to TimeZero is used to select the appropriate points. When live mode is turned OFF, you can select the wind speed to show by clicking on one of the polar curves directly on the graph or by selecting a column in the polar table. In the screenshot below, the selected wind speed is 12Kn as displayed on the lower left corner (2). The theoretical performance of the boat at this speed is indicated by the polar curve displayed in red (1). TimeZero displays all the points that have been logged at this selected wind speed showing your real performance on the graph:
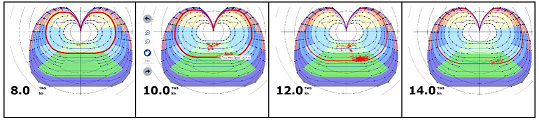
In the examples below, showing the point cloud for various wind speeds, it can be seen that the user mainly sailed in 12 kt of wind, since this is where the cloud is the most pronounced:
When "Live Polar" is selected, you can select how much history you want to display on the polar graph. When "Live Polar" is unchecked, you can select a previous trip, a duration and a starting date:
Modifying the Polar data
It is possible to adjust the polar data by using the table at the bottom of your screen. Just make sure to select "Wind Polar" on the left. Value can me modified (like in a spreadsheet) and column and row can be added or deleted. Just right click on the column or row header you wish to add or delete:
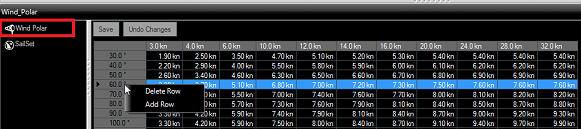
The rows represent the angle in between the wind and the boat (where is the wind coming from relative to the bow of the boat). The columns represent the Wind Speed. So, in the table above, if the True Wind Speed is 20Kn and if the True Wind Angle is 60 degree, the target speed (theoretical boat speed) is 7.5Kn. You can edit this value by selecting the cell and entering the new value.
As soon as you make a change in the table, the graph above will update. If you want to store permanently the modification, make sure to click on the "Save" button at the top of the table. This will write the modification to the polar file on your Hard Drive.
SailSets
The SailSets color can be displayed on the Polar graph from the "Weather" button in the ribbon:
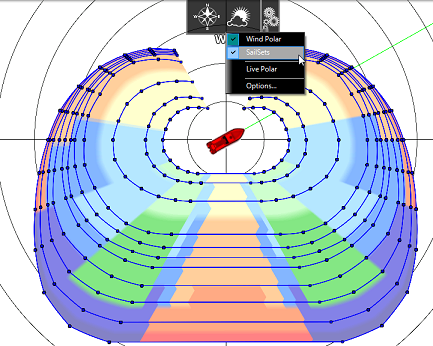
If you select "SailSets" in the list on the bottom left, the Sail Set color table will be displayed. Each cell can be assign new sail configuration using a drop down menu. If you want to change a sail configuration, click on the "SailSets Configuration" button at the top of the table.
Note: For the average user, the default SailSets configuration does not need to be changed. In this case, the color will simply highlight on the chart the type of navigation (Close Hauled, Reaching, etc...)