Side Scan Display
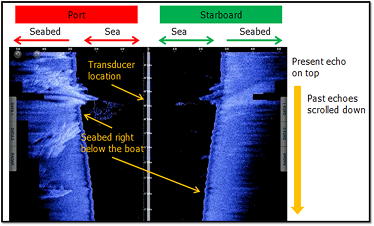
The Side Scan display shows a raw picture generated from the data received by the sonar. The display is drawn on the screen as a waterfall – the newest information appears at the top of the screen, while the oldest falls off the bottom of the screen. This is similar to the way sounder displays operate, except that in this case the new data appears on the top of the screen and the old data disappears at the bottom. The left side of the side scan view shows the signals received from the port side while the right shows signals received from the starboard side:
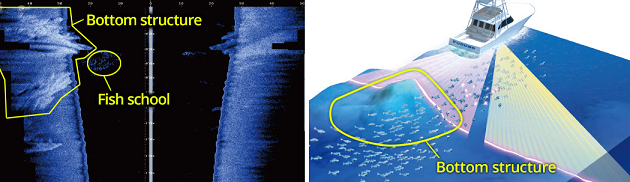
By default, the side scan view starts at the center of the vessel and works its way out to port and starboard. As the side scan image moves further out along the sea-floor, the picture shows features on the sea-floor. Objects, such as rocks, appear as bright white marks followed by a shadow. Harder ground gives strong returns (lighter color on the scale), while a patch of mud or kelp causes a dark patch/shadow to appear.
Note that it is possible to create a mark by double clicking on the side scan picture (or by using the Mark tool located in the Toolbar), however, the mark location on the chart will be an estimate only (as it is not possible to exactly geo-reference the side scan picture).