Selecting Charts & Overlays
TZ iBoat is running the powerful TimeZero graphics engine that can display multiple type of charts (vector charts, raster charts, high resolution depth contour charts) and mix them with various overlays (Satellite Photo, Depth Shading, Weather...) in both 2D and 3D.
By default, TZ iBoat uses a free basic land map (Open Street Map data) that gives you the opportunity to evaluate the App for free. However, in order to display detailed nautical charts, a TZ Maps area needs to be purchased. We provide a 7 days free trial on any TZ Maps area if you would like to evaluate the quality of the data (please refer to Subscriptions for more information).
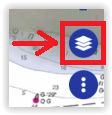
To select the type of chart you want to use, tap on the “Layer” button located at the bottom right side of your screen:
At the very top of the Layer menu, you will see the chart and overlay selection:
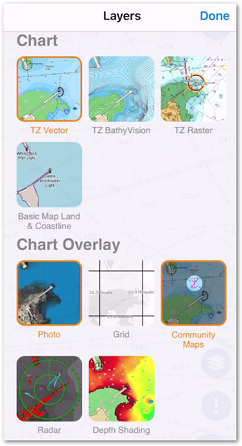
Chart Selection
-
TZ Vector: Select this option to display Vector charts. Vector charts are computer generated from a series of points and lines (stored in a database) that make up the features of the chart on the screen. Various details on the chart can be turned on and off and objects can be tapped on to display more details. When zooming in and out of a vector chart the text and objects keep the same size and orientation.
-
TZ BathyVision: Select this option to display Vector charts together with high resolution depth contour lines. The contour lines are dynamically generated from high resolution bathymetric data, which provides a more comprehensive understanding of the bottom. It is possible to configure the density of contour lines and associated shading to focus very precisely on high-potential fishing areas.
-
TZ Raster (only available on selected areas): Select this option to display "traditional" Raster Charts. Raster charts are a direct copy (or scan) of existing paper charts, and thus look identical to the paper charts it was produced from. All information contained within the chart is printed directly on it, so you cannot tap on objects (such as buoys) like on a vector chart. When zooming in and out of a raster chart, TZ iBoat selects automatically (“quilts”) the best paper charts for the area and scale displayed on screen. Note that in areas with poor chart coverage, everything on the chart grows larger or smaller as you zoom in or out. Also, when rotating a raster chart, everything on the chart rotates with the screen.
-
Basic Land & Coastline: Select this option to display a free basic land map powered by Open Street Map. Note that you should not use this option for Navigation. This option should only be used when trying out the App, or when you want to look at specific details on land.
Note: the first time you select a chart option other than the free "Basic Land & Coastline", a pop up allowing you to start the free trial and subscribe to the TZ Maps for your current position should appear. If it does not appear or if you have closed it accidentally, you can access the “Store” to start your free trial from the “TZ” button located on the top left side of your screen.
Overlay Selection
-
Photo: Select this option to display Satellite Photo over the charts. Note that Satellite Photo are fused with the nautical charts by a method called “PhotoFusion”. Land areas are completely opaque, so that these areas are displayed as high-resolution satellite photos. As the depth increases, the satellite photo becomes more transparent so that the shallows are displayed along with the chart information. As the deeper water begins, the satellite photo disappears, leaving the raster or vector chart. In shallow water, satellite photos may allow you to identify the seabed classification as sand, rock, coral, or other obstructions.
-
Grid: Select this option to display a Lat/Lon grid on top of the chart.
-
Community Maps: Select this option to display charts objects that have been added or modified by the TimeZero community. The Community Maps overlay allows users to contribute to the vector chart by adding their own observations and local knowledge. This layer is designed to promote collaborative charting and boost the accuracy and detail of the vector nautical charts. Note that this overlay is not available with Raster charts.
-
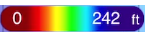
Depth Shading: Select this option to overlay color that will vary according to depth. The depth shading can be applied to raster or any type of vector charts. This unique feature allows you to view water depths at-a-glance with vibrant colors. The color scale is set automatically (TZ iBoat scans for the deepest and shallowest point on the screen and automatically adjusts the upper and lower boundary) and is displayed on the lower left of your screen when the Depth Shading overlay is enabled: