TZ BathyVision
Thanks to the various functions offered by BathyVision, the seabed will no longer hold any secrets for you! TZ Maps offers the best bottom data available and lets you display it dynamically and intuitively in color and/or with contour lines. It is possible to configure the density of contour lines and associated shading to focus very precisely on high-potential fishing areas.
TZ BathyVision
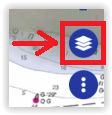
To select BathyVision, tap on the “Layer” button located at the bottom right of the screen:
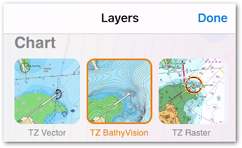
At the very top of the Layer menu, tap on "TZ BathyVision":
This will display on your screen a vector charts where the official contour lines and depth soundings are replaced with depth contour lines that are dynamically generated from a high resolution bathymetric database.
Contour line Density
The contour lines interval is automatically adjusted according to the zoom level. However, it is possible to manually select a density level (from 1 to 5) by taping on the BathyVision setting box located at the bottom left corner of the screen:
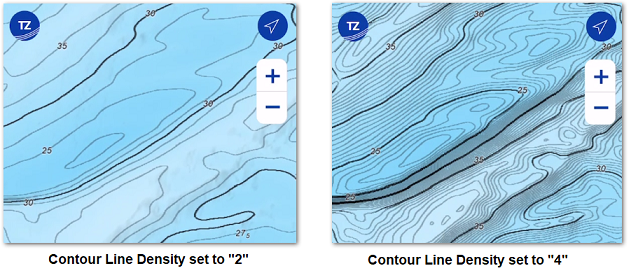
We encourage you to play with the density as some areas with various terrain and slope might benefit from a higher or lower contour line density setting:
Note that you can choose whether or not to display the "Master Contours" on the chart. As not displaying them on the chart gives you a better view of the reliefs when usiing bigger contour line density (this can be done in the Plotter Setings)
Contour Line Smoothing
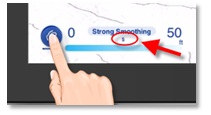
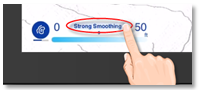
When the contour lines are displayed with a very high density, they may appear too sharp, and the display might appear "noisy". A large number of small, isolated areas can interfere with readability. You can reduce this effect by applying an averaging filter to smooth the contour lines. To do this, set the smoothing value by tapping the BathyVision setting box like shown below:
Color Gradient Depth Range
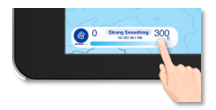
The TZ BathyVision chart background consists of a color gradient that varies from blue (shallow water) to white (deep water). For better contrast in shallow or deep areas, it is possible to adjust the deep water threshold from 20 to 300 feet by tapping on the depth value like shown below:
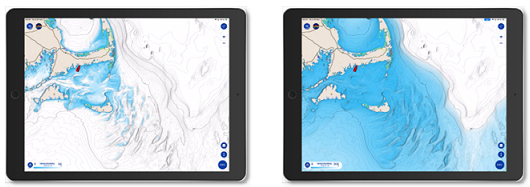
You can see on the two screenshots below the effect of that setting:
Depth Shading
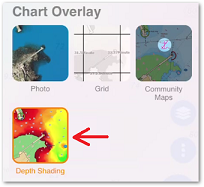
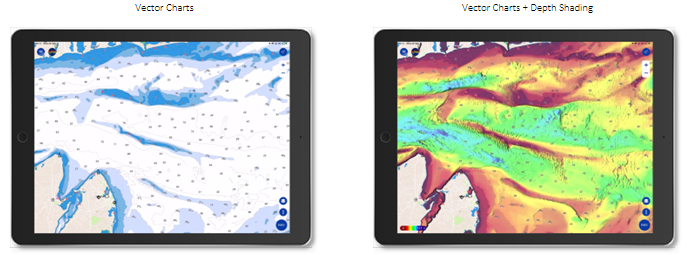
If you would like to visualize bathymetric data using a vibrant color scale, you can enable the Depth Shading overlay. Tap on the "Layer" button and select "Depth Shading" under "Chart Overlay":
TIP: The Depth Shading overlay can be displayed over any type of chart: Vector, Raster, or BathyVision.
When the Depth Shading overlay is enabled, TZ iBoat will use the high resolution bathymetric database to apply a color scale to the depth data:
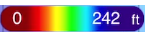
The color scale minimum and maximum values are set automatically: TZ iBoat scans for the deepest and shallowest point on the screen and automatically adjusts the upper and lower boundary. Those values (min and max) are displayed at the bottom left of the screen:
Note that you can change the color palette and the depth shading transparency from the Plotter Settings.
Terrain Shading opacity
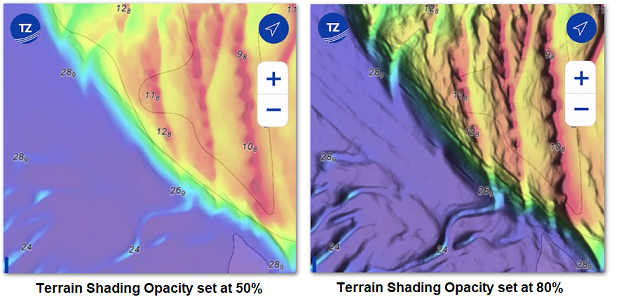
When TZ BathyVision is selected or when the Depth Shading overlay is enabled, a Terrain Shading opacity is automatically applied to the screen. The opacity value of the terrain shading is set to 50% by default but it can be adjusted from the Plotter Settings using the "Terrain Shading Opacity" located at the bottom of the page. In some areas, increasing the Terrain Shading Opacity might reveal the seabed in a stunning way:
Note that you can also choose to display or not the terrain shading in the Plotter Settings.