Viewing a Trip
Trip Detail
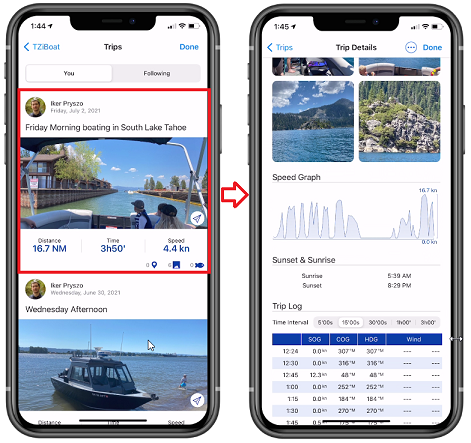
You can access the list of all your Trips (sorted in chronological order) by tapping on the TZ button located on the top left of your screen and selecting "Trips". Once you located the trip you would like to display, just tap on it to open its detail:
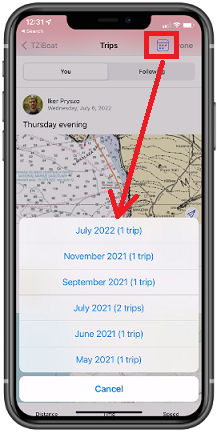
Note that if you have lots of Trips, you can use the calendar icon located at the top right of the screen to quickly access a specific period:
Trip Overview
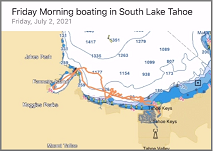
An overview of the trip will be displayed at the top, just below its name. If you tap on the map overview, the trip data will be loaded and displayed directly on the chart (see next chapter).
Trip Statistics
The Trip distance, duration and average speed will be displayed, together with time stamped departure and arrival locations. If you have not given a name to the departure and arrival location after creating the Trip, TZ iBoat will automatically name those points according to your location. You can rename the departure and arrival point anytime by editing the Trip.

Trip Photos and Catches
The photos that you took with TZ iBoat or the photos that were added to the Trip from your Album will be displayed together with the catches that have been created during the Trip. You can tap on a photo to display it in full screen. While displayed, you can swipe left or right to access all photos related to the Trip:
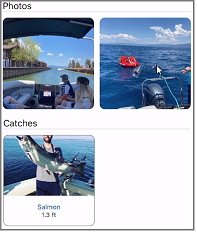
Note: It is not possible to add a Catch after finishing a Trip. Catches are linked to a specific Trip based on their creation date.
Trip Speed Graph
TZ iBoat will display a speed graph (using the speed over ground given by the GPS):

Tide & Sunrise/Sunset information
TZ iBoat will display the tide information as well as sunrise / sunset time of that day:
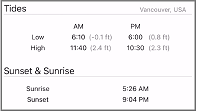
Note: TZ iBoat displays the tide station that is the closest to the departure location.
Trip Log
A detailed log of your trip in the form of a traditional timetable will be displayed at the end of the Trip detail screen. The time interval can be adjusted at the top of the table. Any events you may have created during the Trip will be automatically inserted in the timeline:
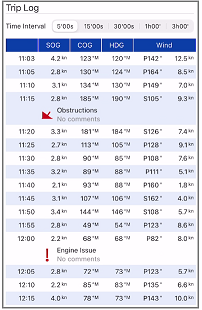
Note: It is not possible to add an event after finishing a Trip. Events are linked to a specific Trip based on their creation date.
Display Trips on the Chart
If the "Trips" button is selected from the Layer button, all your trips will be visible on the chart displayed using thin orange lines (to avoid cluttering the screen):
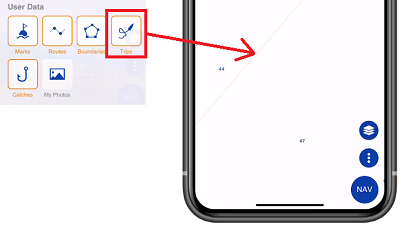
TIP: You can adjust the historical trips transparency from the Plotter settings (under Transparencies).
To select a specific Trip and make it more visible on the chart, just tap on one of the orange lines. When selected, the Trip will be displayed in bold, and an animation will indicate the direction of the Trip. Time markers will also appear along the trip to indicate the duration of specific points:
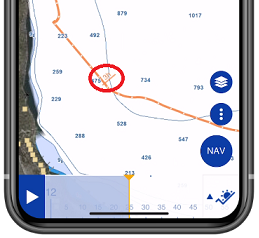
Note: when the trips are not selected (displayed with thin lines), they are simplified to limit the number of points loaded in memory. As soon as you select a Trip, all the points of that Trip are loaded to display the maximum accuracy (up to 5,000 points per trip).
When a Trip is selected, the Time Bar appears at the bottom of the screen. Drag it to see the progression of the replay boat (blue icon) along the Trip:
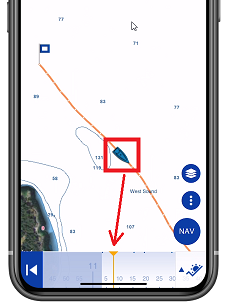
To access data of a specific point along the Trip, tap on it. The pop-up menu will appear displaying all data:
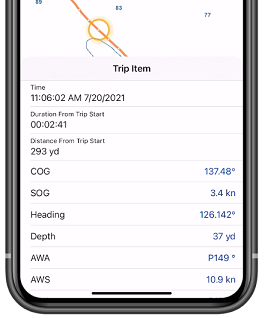
Note: The data that is recorded in the Trip will vary according to the type of instruments that you have connected to TZ iBoat.