Displaying Weather Forecast on the chart
Display Mode
TZ iBoat lets you display the weather forecast in two different ways: either in "Online" mode, the weather will be streamed directly to your device or in "Offline" mode, the weather forecast will have to be downloaded to your device. The "Online" mode is very convenient (you can look at any area and see the weather immediately), but it requires an Internet connection. If you plan to be in an area without Internet connection, you should switch the mode to “Offline” and then download a specific an area (please refer to Downloading Weather Forecast for more information). You can change the mode at any time by selecting "Offline Chart & Weather" under the TZ button, then selecting "Download Weather" and switching from Online to Offline in the bottom left corner of the screen. Another way is to change the mode connection in the Weather Settings.
Display on chart
TZ iBoat can overlay weather forecasts directly on your chart using particles (animation), colors, labels, or traditional arrows. To display weather, simply tap on the “Weather” button located on the TZ Bar on the bottom of your screen (1), select the type of weather data you would like to see among Wind, Waves, Air Temperature, Clouds & Rain, Current, and Pressure (2):
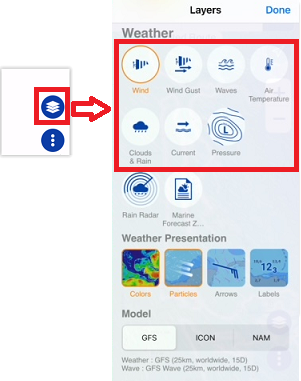
Just below the type of weather data to display, you can select the type of presentation. Note that you can combine multiple display types if you wish. For example, you can choose to display wind in color + arrows + label.
Note that if the "Online" mode is selected and you have subscribed to the Premium Weather service, you can switch from one weather model to another, as shown in screenshot above(3). If you have not subscribed to the Premium Weather service, the model section will not be displayed in the layers, because only one model is available: the GFS model. The same applies if the "Offline" mode is selected, because you can only download and view one model at a time.
Once a weather parameter has been selected, a time bar is displayed at the bottom of the screen:
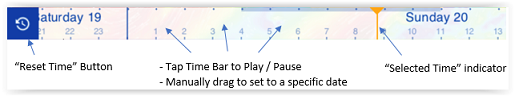
The time bar allows you to play an animation (tap on the time bar anywhere) or you can manually drag it to a specific date & time.
Note that if you are displaying the wind in color, you can adjust the maximum value of the color scale by clicking on the value label to the right of the color palette (1).
This will bring up the slider (2) that allows you to set a value between 0kn and 40kn.
The least extended palette (0-20kn) shows a better variation of the wind in a regular environment, as you can see in the screenshots below (3):
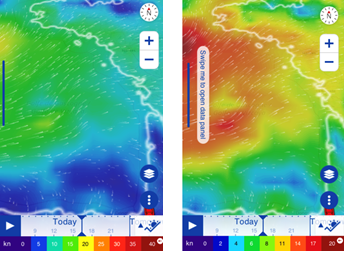
A wider color scale (0–40 knots) is more suitable for tracking storms or severe wind conditions.