Using TimeZero
User Interface Overview
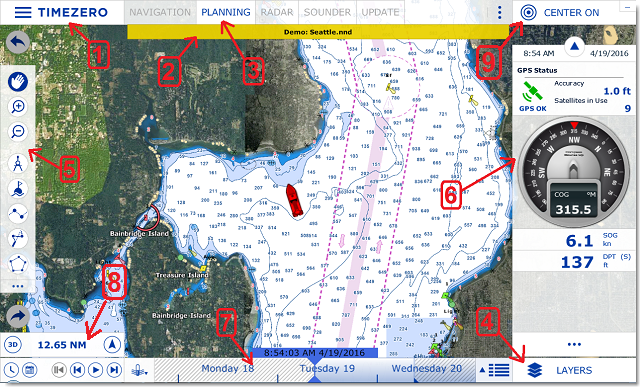
1. "TIMEZERO" button: Click on this button to access the Menus and Options of TimeZero and to exit the software. You will also find a built in User Guide located here.
2. Status Bar: This area displays the general status of the software
3. WorkSpaces: Click on any of the WorkSpaces to select the activity you want to display on your screen. Refer to the WorkSpaces Chapter for more information.
Note: Your WorkSpaces configuration might differ from the screenshot above according to your software configuration and optional Modules.
4. "Layers" button: The "Layers" button opens a panel that allows you to configure various information displayed on the charts.
5. Toolbar: The Toolbar displays all the tools that can be used with the selected window. Once a Tool is selected, a cursor action is required on the chart, such as creating a Mark.
6. NavData: The NavData displays the data received from external instruments such as the GPS, wind sensor, depth sounder etc… It also displays the cursor position and the range and bearing of the cursor from the vessel icon. Route information including Course to Steer, Range to Waypoint, ETA and other graphic data can also be displayed. To configure the NavData, right click on any of the items to select the value to display or to remove it. To add a new value, click on the "..." button located at the bottomof the NavData.
7. Timeline: The timeline (only available in the Planning WorkSpace) allows you to play Weather & Tides animations. Click on the Calendar icon to select a date & time to view the Tide and/or Weather Forecast. When you click on a route, the timeline also allows you to perform route simulation and see all the conditions evolving (tides, currents, weather) according to your route departure time and projected speed.
8. Chart Scale: The Chart Scale displays the horizontal range of the charts. It also includes a "3D" button that allows to toggle in between 2D and 3D presentation and an Orientation button (arrow) that allows you to toggle in between North Up and Head Up.
9. "Center On" button: Click on this button to center the chart on your GPS position. Note that this button can change its action according to the context. For example, when creating a route, this button transforms in "End Route". In the Update WorkSpace, this buttons allows you to open the Weather Update Wizard.
Tips: The WorkSpaces, NavData and Toolbar can be customized by clicking on the Configure Button: 
Note: After customizing the user interface to your preferences, you can save all the settings to a file. Click on the TimeZero button and select "Save UI As...". To reset the user interface to your default settings, simply open TimeZero by double clicking on the User Configuration file. Note that you can make multiple User Configuration files for multiple users or various uses of the software.
Toolbar & Layers
Toolbar
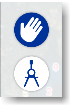
The Active Tool (the tool currently selected) appears surrounded in blue. In the example below, the Panning Tool (hand icon) is selected:
Tooltip
When you left click on the chart or on a specific object, a Tooltip will appear. The Tooltip can combine information (such as range and bearing of the object) with buttons that will allow you to perform specific actions on that object:
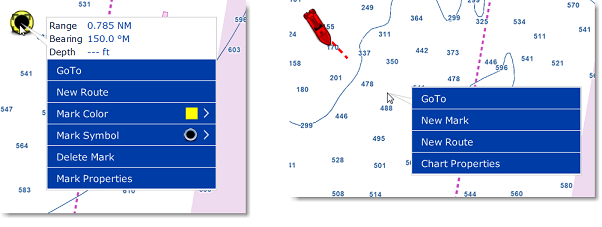
Note that the Tooltip will only provide the most common actions. For a complete list of actions, you can right click on the chart or on an object (this will bring the traditional windows contextual menu).
Layers
Click on the "Layers" button located on the bottom right of the screen to open a panel that allows you to configure what you see on your screen:
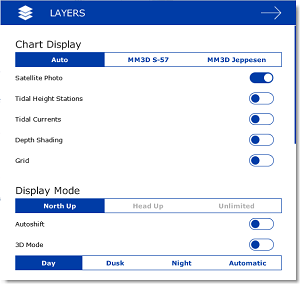
The layer panel also allows you to adjust some settings such as charts orientation (display mode), radar and sounder parameters (when you have the Radar or Sounder module).
You can scroll up and down on the layer panel using the mouse wheel or by clicking and holding (drag). To close the Layer Panel, click anywhere on the chart or click on the close button (arrow) located on the top right.