Tides
TimeZero can predict the tide level for thousands of tide stations around the world. Tides can be displayed directly on the chart or in a graph.
Displaying Tides on the Chart
Click on the "Chart" button located in the Ribbon and select "Tidal Heights Stations":
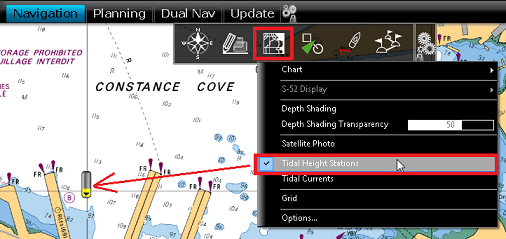
The tide icons displayed on the chart are dynamic and show you a preview of the water level:
![]()
Rising from low to high
![]()
Falling from high to low
![]()
At slack (low and high)
TIP: The Tide icon size can be adjusted from the Plotter Display Options.
If you put your cursor over a tide icon or click on it, a tool tip indicating the Tide level will appear.
If you are in the Navigation WorkSpace, the tide level is displayed for the current time. If you are in the Planning WorkSpace, you can change the time using the timeline located at the bottom of the screen.
IMPORTANT: All tidal height prediction times in the Navigation WorkSpace are adjusted for the local time currently selected on your computer. Make sure that your computer is set at the correct time and that the local time zone is properly selected for your area. To change the computer's time zone or daylight savings time setting, use the "Date and Time" option in the Windows Control Panel.
Displaying the Tide Graph
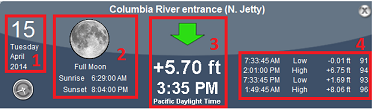
To display a Tide Graph, right click on a Tide icon and select "Open Tide Graph" (or double click on the tide icon). You can also right click anywhere on the chart (in this case it will use the nearest Tide Station from cursor position). This opens a window displaying various tides related information (tide level, low/high tide time, moon phase, sunrise/sunset time):

To change the time, you can drag the graph with your mouse, use the scroll wheel or use the right/left arrow of your keyboard.
Tips: To scroll the graph over a long time period, you can put your cursor over the day or month on the time bar and drag from this location. This will increase the scrolling speed.
To set the time of the graph back to the current time, click on the clock button: ![]()
Note: If you open the Tide Graph from the Planning WorkSpace, the time of the graph is initialized to the same time selected in the Virtual Time Control (Time Bar) of the WorkSpace.
-
Selected date
-
Moon and Sunrise/Sunset information
-
Tide level and Time (with Time Zone indication)
-
Time, Level and Coefficient for previous and next high/low