Displaying Rain Radar
IMPORTANT: Due to the near-real time aspect of this feature, the Rain Radar requires an Internet connection. It is not possible to cache the data like it is for weather forecast. The Rain Radar feature requires a subscription to the Premium Weather service (please refer to Subscriptions).
The Rain Radar displays active precipitation areas, almost anywhere in the world. The last three hours of rain radar data can be animated at 10 minutes interval directly on the chart. This will allow you to see the storm track and have a good idea of where the rain is headed next.
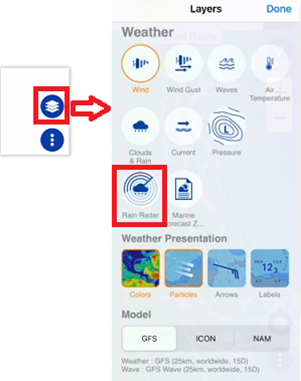
To display the Rain Radar, simply tap on the “Layers” button located on the bottom right of your screen and select "Rain Radar" from the “Other Layers” section:
After a brief moment, the rain radar color will appear on top of your charts:
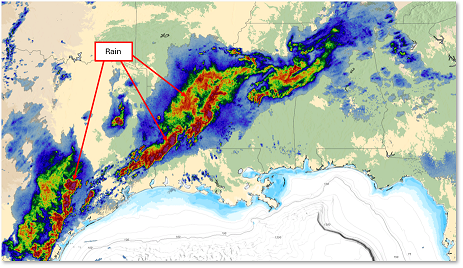
The colors vary according to the precipitation intensity, red and purple being used for heavy precipitations/storms. The color legend is displayed at the bottom of the screen in mm/h or in/h (the unit can be changed from the Units Settings).
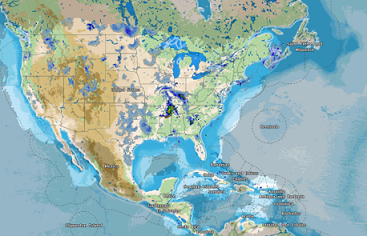
Because radar coverage is an important information: to discriminate in between “no rain” and “no coverage”, a special color is used (dark gray) to indicate areas that are outside any radar coverage when the Rain Radar layer is activated. In the example below light areas correspond to the areas covered by the radars:
To start the rain radar animation and watch the evolution of precipitation over the last three hours, click on the "play" button located in the timeline at the bottom left of the screen. When the Rain Radar is displayed, the animation will automatically loop, helping anticipate precipitation movements.
Note: The animation speed can be adjusted from the General Settings under "Animation Replay Speed".