Premium Ocean-O Service
In addition to the standard (free) oceanographic data, a premium service providing higher resolution and multi-layer data can be purchased through your dealer. The high-resolution oceanographic data available with this service is a key factor in targeted fishing for the optimal performance. Subscription to this service also unlock a new WorkSpace (the "Ocean-O" WorkSpace) that was designed and optimized to visualize, filter and combine all the oceanographic data in order to find the best fishing spots. Also note that the premium Ocean-O service includes all the benefits of the Premium Weather Service.
| Included | Premium Ocean-o | |
| Wind | 25Km | 1Km (selected area) |
| GFS (0.25 * 0.25) | GFS (0.25 * 0.25) Arome (0.01 * 0.01) Arpege (0.1 * 0.1) NAM CONUS USA (0.03 * 0.03) ICON Europe (0.06 * 0.06) ICON Global (0.12 * 0.12) |
|
| Wind Gust | 25Km | 1Km (selected area) |
| GFS (0.25 * 0.25) | GFS (0.25 * 0.25) Arome (0.01 * 0.01) Arpege (0.1 * 0.1) NAM CONUS USA (0.03 * 0.03) ICON Europe (0.06 * 0.06) ICON Global (0.12 * 0.12) |
|
| Pressure | 50Km | 50Km |
| GFS (0.5 * 0.5) | GFS (0.5 * 0.5) Arome (0.5 * 0.5) Arpege (0.5 * 0.5) NAM CONUS USA (0.5 * 0.5) ICON Europe (0.5 * 0.5) ICON Global (0.5 * 0.5) |
|
| Air Temperature | 25Km | 1Km (selected area) |
| GFS (0.25 * 0.25) | GFS (0.25 * 0.25) Arome (0.01 * 0.01) Arpege (0.1 * 0.1) NAM CONUS USA (0.03 * 0.03) ICON Europe (0.06 * 0.06) ICON Global (0.12 * 0.12) |
|
| Cloud | 25Km | 1Km (selected area) |
| GFS (0.25 * 0.25) | GFS (0.25 * 0.25) Arome (0.01 * 0.01) Arpege (0.1 * 0.1) NAM CONUS USA (0.03 * 0.03) ICON Europe (0.06 * 0.06) ICON Global (0.12 * 0.12) |
|
| Precipitation | 25Km | 1Km (selected area) |
| GFS (0.25 * 0.25) | GFS (0.25 * 0.25) Arome (0.01 * 0.01) Arpege (0.1 * 0.1) NAM CONUS USA (0.03 * 0.03) ICON Europe (0.06 * 0.06) ICON Global (0.12 * 0.12) |
|
| Humidity | 25Km | 1Km (selected area) |
| GFS (0.25 * 0.25) | GFS (0.25 * 0.25) Arome (0.01 * 0.01) Arpege (0.1 * 0.1) NAM CONUS USA (0.03 * 0.03) ICON Europe (0.06 * 0.06) ICON Global (0.12 * 0.12) |
|
| Wave (significant) | 50Km | 3Km (selected area) |
| WW3 (0.5 * 0.5) | WW3 (0.5 * 0.5) Arome (0.02 * 0.02) Arpege (0.1 * 0.1) Copernicus Global (0.08 * 0.08) |
|
| Surfacic Current | 8Km | 8Km |
| (0.08 * 0.08) | (0.08 * 0.08) | |
| Sea Surface Temperature | 16Km | 1Km |
| (0.16 * 0.16) | (0.01 * 0.01) | |
| Sea Surface Height (Altimetry) | 8Km | 8Km |
| (0.08 * 0.08) | (0.08 * 0.08) | |
| chlorophyll | 4Km | 4Km |
| (0.04 * 0.04) | (0.04 * 0.04) | |
| Water Temperature (Multi-Layer) | N/A | 8Km |
| (0.08 * 0.08) | ||
| Thermocline | N/A | 8Km |
| (0.08 * 0.08) | ||
| FSLE | N/A | 3Km |
| (0.03 * 0.03) | ||
| Dissolved Oxygen (Multi-Layer) | N/A | 25Km |
| (0.25 * 0.25) | ||
| Primary Production | N/A | 25Km |
| (0.25 * 0.25) | ||
| Phytoplankton | N/A | 25Km |
| (0.25 * 0.25) | ||
| Current (Multi-Layer) | N/A | 8Km |
| (0.08 * 0.08) | ||
| Shear | N/A | 8Km |
| (0.08 * 0.08) | ||
| Sea Ice | N/A | 8Km |
| (0.08 * 0.08) | ||
| Sea Water Ph | N/A | 25Km |
| (0.25 * 0.25) |
Type of Oceanographic Data
Sea Surface Temperature (SST)
Sea Surface Temperature (SST) has long been a valuable tool for fishermen, as it helps identify optimal fishing areas based on the preferred temperature range of different species. Since some fish stay near the surface, SST is particularly useful for locating them. Fishermen also seek out temperature breaks—zones where the water temperature changes rapidly—since these natural barriers attract fish, causing them to gather or swim along the front. To easily identify these areas, using the "Front" presentation type is recommended. With the Premium Ocean-O Service, you can choose between two SST data sources, each offering unique advantages. You can change the SST data source from the Weather Options, under the "Ocean-O" category.
JPL SST MUR (default selection)
JPL SST MUR is a global observation product that seamlessly merges SST data from satellites with varying resolutions (1 km to 25 km) to create a blended 1 km resolution dataset. Its key advantage is providing continuous SST coverage, even in cloudy areas ("cloud-free SST"). However, in these regions, the displayed data may be less reliable, as it is often older or extrapolated at a lower resolution. While this dataset offers a clear, gap-free global view of SST, you may also want to explore the secondary SST data source for comparison.
NOAA ACSPO L3S
NOAA ACSPO L3S is a Global Observation Product with gaps due to cloud but with a 2 Km real resolution that allows to accurately identify SST fronts on very small scales. The SST offers two key advantages: it provides higher real-world resolution than the JPL MUR data source and accurately represents satellite observations without modifications or alterations.
The primary drawback is that when the satellite cannot measure water temperature—typically due to cloud cover—the SST ACSPO lacks data, resulting in coverage gaps. However, for some users, these gaps can be an advantage, as they enhance confidence in the accuracy of the available measurements. If you’re in a region with frequent cloud cover, switching to the JPL SST MUR model may be a better option.
Sea Water Temperature (SWT)
SWT or “Sea Water Temperature” is very similar to SST but is not restricted to the surface. SWT has several depth layers and TimeZero makes it possible to check water temperature at any depth (using the Oceanogram, Plot Window or manually setting the Depth Layer). SWT is computed from advanced oceanic models and is not as accurate as SST which comes from satellite observations. However, the advantage of SWT is its ability to provide water temperature at multiple depths allowing TimeZero to compute thermocline (see below). Because SWT is computed from a mathematical model, it also provides up to 10 days forecast. In summary, SWT can be very useful for species that may not be always found near the surface.
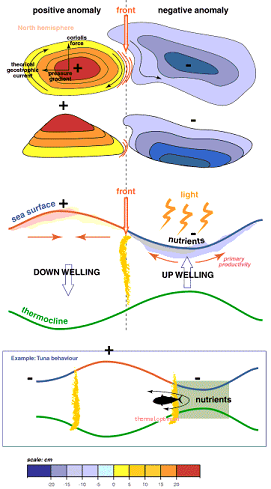
Sea Surface Height (SSH - Altimetry)
The sea surface level is not flat! The water level rises and falls according to the water column temperature and other factors. Water which is relatively colder will be heavier than warmer water. This heavier water will cause a difference in SSH or "Sea Surface Height" (also referred sometimes as "Altimetry"). High spots in the ocean surface column associated with positive values are usually nutrient-poor waters. Low spots in the ocean surface column associated by negative values are nutrient-rich areas and have everything needed to attract food for pelagic fish and other predators that are at the top of the food chain. Many times, areas found between high and low spots form "oceanic highways" where fish are most likely to be found (because fish like to hunt in low areas and rest in high areas). Finding SSH “fronts” (near SSH=0m) is important for fishermen, because fishes like Tuna often cross this border.
FSLE
FSLE, available exclusively with the premium Ocean-O service, reveals dynamic ocean behaviors by highlighting areas of stretching and convergence. Unlike traditional data, FSLE provides deeper insights into fluid movement, helping you locate areas with increased nutrient and organism concentration. For more information about what FSLE is, please refer to this chapter.
Chlorophyll, Phytoplankton & Primary Production
Chlorophyll is a color pigment found in plants, algae, and phytoplankton. The chlorophyll data comes from satellite (observation), while Phytoplankton & Primary Production are computed from models (partially deduced from chlorophyll data). Chlorophyll is commonly used by fishermen because there is a well-known correlation between chlorophyll concentration and fish location. Small fishes like to stay in high concentration areas where the food (microorganisms) can be found. Larger fishes like Tuna are more likely to be found at the edge of areas that are high in chlorophyll concentration. They usually go hunt inside the high concentration areas to feed, but then retreat in low-chlorophyll concentration areas to find "comfort" (better visibility with more oxygen). It is recommended to use the Chlorophyll with the Front presentation type to locate these areas (edge).
Thermocline
Water temperature usually decreases slowly according to depth, but sometimes, at a specific level, the water temperature can drop quickly. The depth where this rapid change occurs is called the thermocline. The thermocline consists of two parameters: Depth and Strength. The thermocline strength shows how quickly the water temperature changes, while the thermocline depth indicates its location in the water column. Note that the thermocline does not indicate a fish probability location, but instead gives an indication of the capturability (likelihood of capturing fishes at that location). When the thermocline is weak or well below the net, fish can escape from below and the capturability is low. However, when the thermocline is strong (sudden change of temperature) and when the net is located just above the thermocline, it acts like a natural barrier decreasing the likelihood of the fish to escape.
Current & Shear
Current is a multi-layer data and it is possible to check speed and direction at the surface, but also at any depth. TimeZero uses that multi-layer data and compute the "shear" which is similar in principle to the thermocline, but for current data. The shear will indicate the depth at which currents change drastically. Nets that are positioned in high shear areas can become "distorted" by the currents variation and fishermen should avoid these areas.
Salinity & Dissolved Oxygen
Salinity is the salt concentration in sea water. One unit of salinity is PSU (Practical Salinity Unit) is equal to 1 gram of salt per kilogram of water. Salinity is usually inversely proportional to dissolved oxygen (which is the O2 concentration in sea water), so you can look at one or the other parameter according to your preference. Fish body tissues contain less salt than the water in which it lives. Fish regulates their own salt concentration by osmoregulation. But osmoregulation varies from one specie to the other, and they each all have their own salinity “comfort zone”. Note that this data is usually not as important a factor as SST, Altimetry or Chlorophyll, but can be used as an additional filter to narrow a search area.
Sea Water pH
As the amount of dissolved carbon dioxide in seawater increases, declining pH indicates increasing acidity. On average, pH level of the world's seas have already dropped—on average from 8.2 to 8.1 on the pH scale (lower numbers are more acidic). That's a 26 percent drop in the past century (because the pH scale is logarithmic). Ocean acidification is best known for its osteoporosis-like effects on shellfish, which makes building and maintaining shells difficult for these creatures such as commercially valuable oysters and clams.
Sea Ice
Sea Ice includes Ice Concentration, Ice Thickness and Ice Drift Speed/Velocity. This data is very valuable in extreme North or South latitude.
Ocean-O WorkSpace
When subscribed to the Ocean-O Premium service, a new “Ocean-O” display is unlocked after activating the service. To activate the service (once you have an active subscription), select the "Update" WorkSpace and click on the "Go Premium" button:
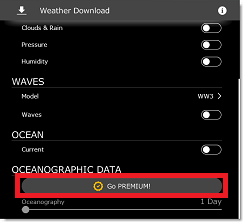
If you have an Internet connection, the activation will be automatic and you can start to download weather data right away. If you do not have an Internet connection, but are able to send/receive e-mail (using a Satellite Phone for example), you will be able to activate the service by e-mail (simply follow the on-screen instructions after clicking on "Go Premium").
Once the service is activated, you can configure the new Ocean-O display as a full or split screen WorkSpace (if you want to display two independent set of data side by side). The Ocean-O WorkSpace allows you to configure and precisely adjust the display of any type of oceanographic and weather data. For multi-layered data, it is possible to select the depth at which the data is rendered on screen. This WorkSpace also offers access to specific tools such as the Oceanogram, Auto-Filters and Plot window.
Configuring the Ocean-O WorkSpace
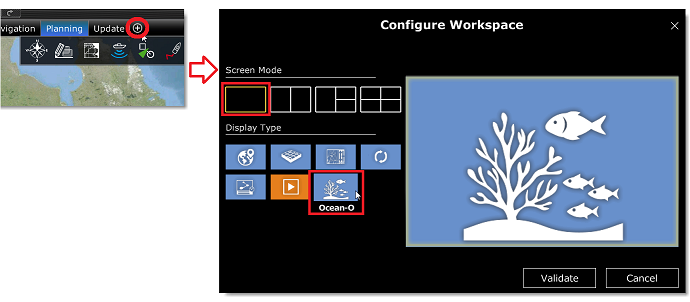
If the Ocean-O WorkSpace is not available at the top of your screen, click on the "+" button to add a new WorkSpace. Select the full screen mode or split screen mode and then select the "Ocean-O" display type:
Selecting and adjusting data display
TIPS: Before configuring the Ocean-O WorkSpace, it is recommended to download a weather file using the Update WorkSpace so that you are able to select and configure the data you want.
The Ocean-O WorkSpace includes additional controls on the right side of the screen (named the "Ocean-O panel") that allow to add, configure and display weather and oceanographic data:
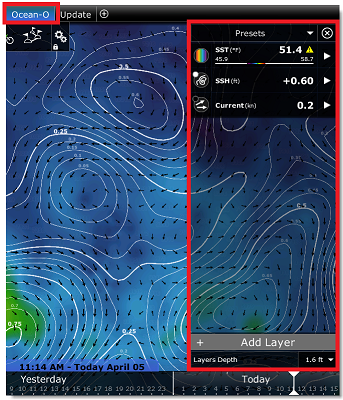
By default TimeZero is configured with three "layers" (SST displayed in color, SSH displayed with isolines, and Currents displayed with arrows). To add a new layer, click on the "Add Layer" button located at the bottom of the Ocean-O panel. This opens a window that allows you to select the presentation and type of data you want to add:
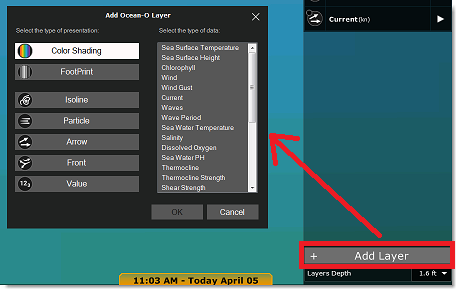
TimeZero offers various type of presentations:
-
Color Shading: displays the data using a traditional color palette
-
FootPrint: displays the data with a uniform shade that is useful when you want to combine and highlight areas that match multiple parameters (areas with overlapping footprint coverage will be displayed with a darker shade)
-
Isoline: display the data with contour line and is useful when combined with another data type displayed in color (for example Sea Surface Temperature displayed in color together with Altimetry displayed with isoline)
-
Arrow: shows the direction of a specific data (current, wind…)
-
Front: highlights areas with a sudden change such as areas with big temperature change
-
Value: displays text label on a fix grid
Once you selected the type of presentation, you can select the data type among what is available in TimeZero (what you have downloaded). After clicking on "OK" the layer will be added to the Ocean-O panel:
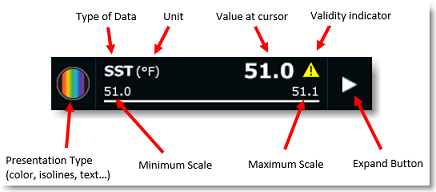
When the presentation type is set to isoline, footprint, label, value or arrow, a small dot will indicate the color used to display the corresponding data data:
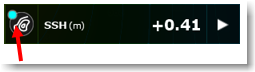
You can quickly toggle the display of the layer ON or OFF by clicking on the presentation type icon:

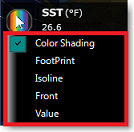
You can also change the presentation type of a layer that is already configured by right clicking on the presentation type icon:
Note that the layer can be expanded or collapsed. When expanded, you can adjust many parameters that will affect how this data will be displayed on the chart:
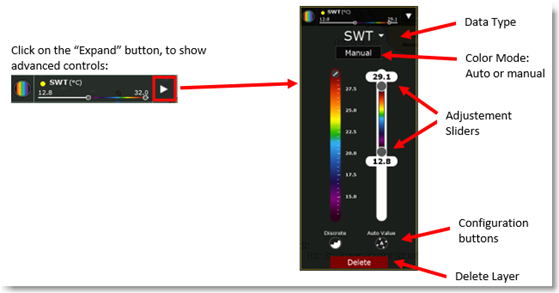
When the presentation type is set to Color Shading, you can change the color palette used by clicking on the pencil icon:
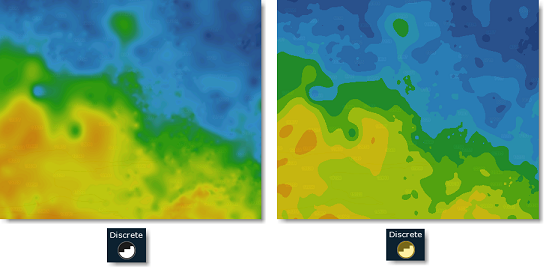
Note that you can choose to use "continuous" colors (default), or "discrete" colors if you press the corresponding button located at the bottom of the color scale:
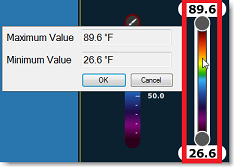
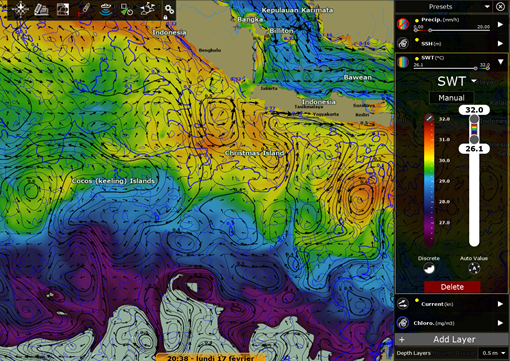
The Color Shading presentation type has two operating modes: "Auto" or "Manual". In "Auto" mode, the maximum/minimum values applied to the color scale sliders are set automatically according to what is currently displayed on your screen (the screen coverage). This mode is very useful to highlights the variation of the data at any scale or location. However, if you prefer to set yourself the minimum/maximum scale sliders (to highlight specific areas matching these conditions), you can change the mode to "Manual". Note that in "Manual" mode, you can double click anywhere on the sliders to open a window that will let you enter the minimum and maximum value using your keyboard:
TIPS: When you are in "Manual" mode, you can press the "Auto Value" button. This will do a "one shot" automatic configuration of the maximum/minimum value according to what is currently displayed on your screen: ![]() .
.
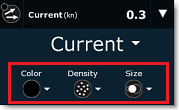
For other type of presentation (isolines, label, ...) expanding the layer will reveal various settings such as color, density or size:
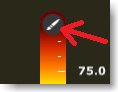
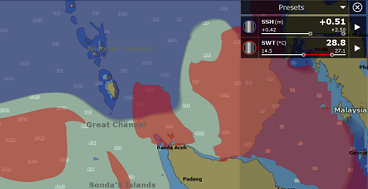
Finaly, user can select "Front" to highlight areas with a big gradient. Traditionally, quick changes in data value (big gradient) could be located by analyzing isolines (looking for areas with shorter distance in between lines) or by looking at the quick variation in color scale. But to save time, the “front” presentation type can be used instead. For example, in the picture below, the blue color highlights areas with sudden changes in Altimetry:
Note that with the Front presentation type, you can adjust a slider that will simply raise or lower the gradient intensity threshold.
Multi-layered data
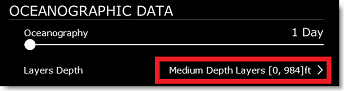
Some data such as Sea Water Temperature, Currents, Salinity, Dissolved Oxygen and pH are available at multiple depth. When you select the data you want to download from the Update WorkSpace, you can also select the range of depth layers you want to include:
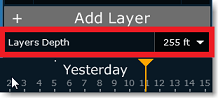
From the Ocean-O WorkSpace, a drop down menu will appear allowing you to select the depth you want to use for all the data that are multi-layered:
Note that additional tools (such as the Oceanogram and the Plot window) allows you to see and analyze multi-layered data according to depth. Please refer to the "Oceanogram" and "Plot Window" paragraphs below.
Combining multiple type of data
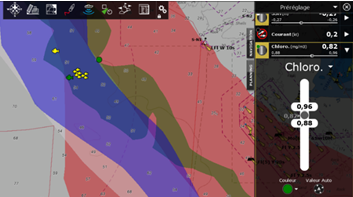
A core strength of the Ocean-O WorkSpace is to be able to combine multiple type of data on your screen. You can add as many layers as you want and combine several types of data using different types of presentation. For example, in the picture below:
-
Altimetry is displayed with black isolines
-
Water Temperature is displayed in color shading, with colors varying from 26.1°C to 32°C
-
Currents are displayed using black arrows
-
Chlorophyll is displayed using blue isolines.
But if you want to highlight areas that match multiple parameters, you can use the "FootPrint" presentation type. FootPrint uses a uniform color showing on the chart the areas that contain data in between the minimum and maximum slider. By adding multiple "FootPrint" for various type of data you will see darker shade corresponding to areas that match multiple parameters:
Note that you can also use different color for each FootPrint. This might help you identify which parameters overlap or to highlight "no go" areas (for example area with big waves that would render fishing operation impracticable):
Another way to display multiple data at once is to configure a split screen with two Ocean-O display side by side. Simply create a new WorkSpace, divide the screen in two and select two Ocean-O display:
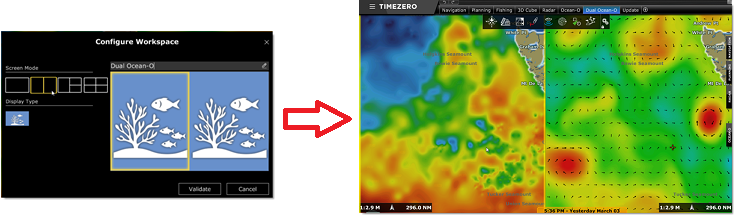
When you configure a WorkSpace with two Ocean-O display, the charts will be interlocked by default so that the same area is always displayed on the two sides as you pan and zoom the screen.
Note: You can disable the interlock by unchecking "Link Displays" from the "Mode" button in the Ribbon.
You also have access to another Ocean-O panel for the left side that you can configure completely independently.
TIPS: When you have two Ocean-O displayed side by side, the two panels will take lots of screen space. We recommend to close the Ocean-O panel once you are done with the initial configuration by clicking on the close button available on the top of the right panel next to the "Preset" selection (this will close both panels)
Auto-Filter
Ocean-O Auto Filter is an advanced decision-support tool designed to quickly identify areas sharing similar oceanographic conditions. When you select a reference point by right-clicking on the chart and selecting Auto Filter, the system automatically recalculates and adjusts the Min/Max scale of all visible Ocean-O layers displayed in Color Palette or Footprint mode (such as Sea Surface Temperature (SST), chlorophyll concentration, altimetry, and more).
As a result, zones with characteristics matching the selected location immediately stand out on the chart, making pattern recognition fast and intuitive:
This feature is especially useful after a successful fishing trip. By setting the calendar to the exact catch date (and ideally the time) and running Auto Filter on the productive location, you can highlight other areas that exhibited the same oceanographic conditions at that moment. Since these parameters evolve over time, using the correct historical date is essential for meaningful analysis. So make sure to enable "Keep History when downloading weather data" from the Weather Options.
After running Auto Filter, the reference area used for the calculation is displayed as a red circle on the chart. To refine the results, you can zoom into a more specific area and run Auto Filter again, or manually adjust the Min/Max ranges using the sliders in the side panel.
Once satisfied, the configuration can be saved as a preset (see below), allowing you to compare multiple scenarios over time and identify recurring patterns or correlations that may improve future decision-making.
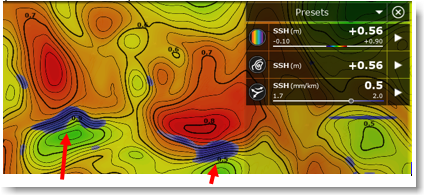
Presets
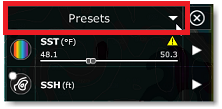
TimeZero comes pre-loaded with a couple of presets that can be used as a starting point. To select a preset simply click on the "Presets" drop down menu at the top:
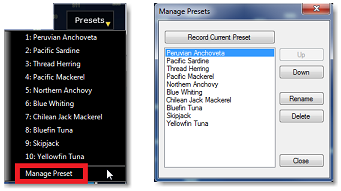
You can create (save) your own presets from the same drop down menu by selecting "Manage Presets":
Oceanogram
The Oceanogram is an advanced feature that allows you to study the profile of a water column parameter along a line:
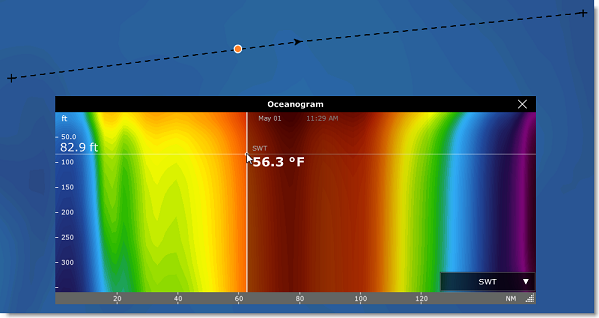
You can select the data you want to analyze using the drop down menu located at the bottom right of the window:
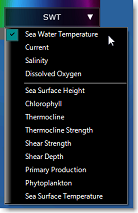
Note that the top selection allows you to select the multi-layered data you want to display in color, while the bottom selection allows you to superpose other type of "surfacic" parameter(s).
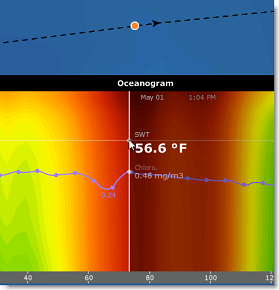
In the example below, the Sea Water Temperature is displayed in color (multi depth layer along the line) with the Chlorophyll curve (corresponding to chlorophyll data at the surface). It is interesting to note at the cursor position (marked by an orange dot on the chart) the rise of the chlorophyll on top of a warmer water column:
Plot Window
The Plot window allows you to drill down into any multi-layered data (water temperature, currents, salinity, oxygen and PH). Simply right click anywhere and select “Show Plot Window”. A graph showing the variation of the selected data according to the depth will be displayed. In the example below, the Sea Water temperature is being displayed at a location (indicated by the orange dot on the chart) revealing the thermocline depth:
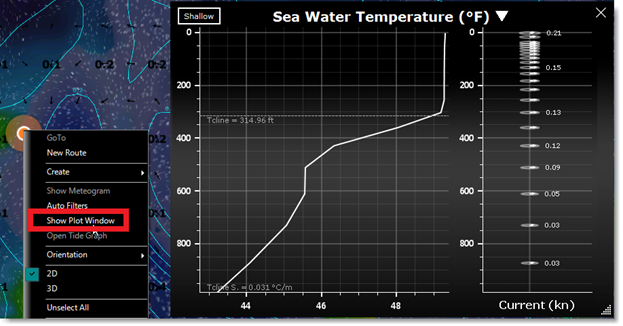
Note that the currents direction and intensity (according to depth) are also displayed on the right side.
Forecast
Just like for weather data, some oceanographic data (data based on models and not observation) can include forecast data. Although Oceanographic data are not as "dynamic" as weather (they are much slower), forecasts will allow show you trend. When you select the data you want to download from the Update WorkSpace you can select a forecast range for both Weather data (at the very top) and Oceanographic Data. You can then use the timeline of the Ocean-O WorkSpace to adjust the time and display forecasts.
Note that if the timeline is set to a date that is farther than 48H apart from the last observation or forecast of a particular data, a warning will be displayed:
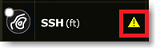
Note that it will be typically the case when adjusting the timeline in the future for data that cannot be forecasted (such as SST which is an "observation" only).
Advanced Settings
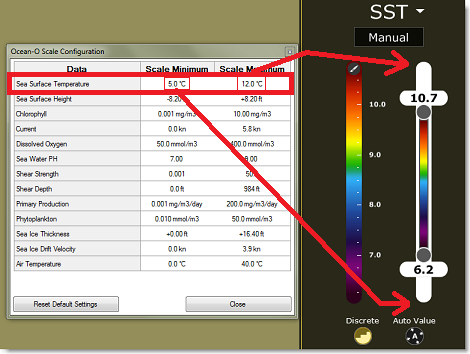
To support a wide array of customers, TimeZero uses default minimum and maximum scale values that are very wide. For example, by default, the SST sliders can go down from -3C to +32C. But you will certainly not need such a wide range for your application. So, in order to make the sliders easier to adjust, you can change every minimum and maximum scale values from the Weather Options by clicking on the "Ocean-O Scale Configuration" button:
By default, when you download new data, the previous data is erased (to only keep the latest data). With the Ocean-O Premium service, you have the option to keep a record of the old data in your database. Simply enable "Keep History when downloading weather data" from the Weather Options.