Scrolling & Zooming
TimeZero offers a new ultra-fast cartographic engine with unparalleled seamlessness and speed of zooming. TimeZero will always select the best charts as you scroll around and zoom in and out. Because scrolling and zooming are so important, TimeZero provides you with several ways of doing them using the mouse or keyboard.
Scrolling the Charts
Panning Tool:
![]()
The Panning Tool is the default tool of TimeZero. If it is not selected, click on the Panning tool (hand) located on the Toolbar and move the cursor over the chart to the center of the screen.
-
Press and hold the left mouse button while moving the cursor to scroll or drag the chart around
-
Double-click with the hand tool on a chart point to center automatically on that point
Note: The panning tool is automatically selected by default after every action. This feature can be disable from the General Options if you uncheck "Enable Auto Hand Tool Selection"
Using the Keyboard:
The Arrow Keys on the keyboard can also be used to scroll the chart. Holding down an Arrow Key moves the displayed chart area in the direction of the arrow.
Zooming the Charts
TimeZero allows you to seamlessly zoom in or out to the exact magnification level you like without steps or limitations.
Using the Mouse Scroll Wheel:
If the mouse has a wheel, roll the wheel up and down to zoom in and out. By default, the chart will be zoomed at the location of the cursor. This can be changed to the center of the screen by enabling "Center on screen when Zooming" from the General Options.
Note: Using the Scroll Wheel is the best practical method to change chart scale without having to change the active tool.
Using the Zoom +/- Buttons:
By default, the Zoom In and Zoom Out buttons are available in the Toolbar in every WorkSpace. Simply click on the corresponding button to Zoom In or Zoom Out by fixed increment.
Using the Zoom Tool:
The Zoom Tool is hidden by default. Click on the "Configure" button (at the very end of the Toolbar) to add it to the Toolbar configuration. The Zoom Tool is very powerful to zoom and pan the chart at the same time (especially if your mouse has no scrolling wheel). Select the tool by clicking on it, move the cursor over the chart, then left click to Zoom In or right click to Zoom Out.
Using the keyboard:
Use the Page Up / Page Down key or +/- keys to zoom in or out.
Note: When zooming with the Zoom +/- buttons or +/- keys, TimeZero uses predefined chart scale that can be adjusted from the Plotter Display Options menu (using the "Chart Scales Selection" button).
Scale & Range value
The Scale and Range of the chart are displayed on the bottom left of your screen. When the chart display is Overzoomed, the scale is written in red.
The range indicates the real distance from the left side to the right side of the chart screen. On the example below the distance represented on the screen is 26.59 Nautical Miles.
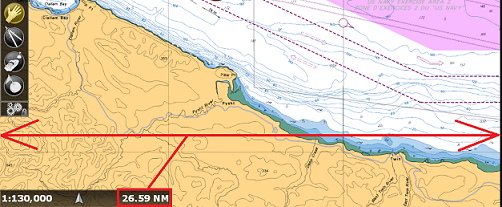
The chart scale is expressed as a ratio (1:130,000 in the example above), so the unit of measure does not matter. On a chart whose scale is 1:130,000, one inch the screen represents 130,000 inches in the real world.
The chart scale and range vary according to the zoom level but also according to the latitude (due to the Mercator projection).
You can also display additional chart information by enabling "Display Chart Info Legend" from the Plotter Display Options. The information shown will depend on the chart type (Vector or Raster) and the current viewing conditions.
For Vector charts:
-
"Overscale" will appear in red when the chart is zoomed in beyond its optimal resolution.
-
"Larger Scale Available" will appear in yellow when a more detailed vector chart is available at a lower zoom level. If you click on it, TimeZero will zoom at the appropriate level automatically.
-
If neither condition applies, the name of the current Vector Chart preset will be displayed.
For both Raster and Vector charts:
-
The chart’s depth unit will be shown on the right side.
-
If this unit differs from the depth unit set in TimeZero, it will be highlighted in red.
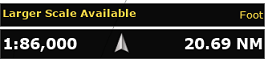
Chart Location
Chart locations can be saved and recalled in TimeZero. This can be useful to quickly set your chart screen to a specific location (for example a Harbor Entrance, Anchorage Area or any other locations that are important ). To save a chart location, pan and zoom to the correct location to adjust the chart screen as desired, click on the "POI" button located in the Ribbons and select "Manage Location...":
Note: If the "POI" button is not displayed in the Ribbons at the top of the screen, click on the "Configure Ribbons" button (on the right side of the Ribbons) to add it to the configuration

If you want the Zoom Level (Chart range) to be saved with the location, select "Save Chart Zoom Level". If you want to save the type of chart currently selected (Raster, C-Map, etc...) make sure to select "Save Chart Selection". This can be useful if a specific chart is better for a specific location.
Click on "Record Current Location" to name and save the location currently displayed on screen. Once the location is added to the list, you can reorder it using the "Up" and "Down" button. Make sure to click "OK" to close the Chart Locations window and save the location.
After one or multiple locations have been saved, you can quickly recall a location from the "POI" button in the Ribbons by selecting "Recall Locations". This will open a sub-menu with all your saved location.
Location can also be recalled using Quick Access NavData or Shortcuts (using the location number).
If you want to delete, rename or change the order of any location, just select "Manage Location..." from the "POI" button.
Note: A maximum of 12 locations can be saved.