Tidal Currents
TimeZero can predict tidal currents for thousands of current stations around North America. In Western Europe, High Resolution Tidal Currents are available for an additional fee. Please refer to the Mapmedia Catalog for coverage.
Tidal current can be displayed directly on the chart or in a graph.
Displaying Tides on the Chart
Click on the "Chart" button located in the Ribbon and select "Tidal Currents":
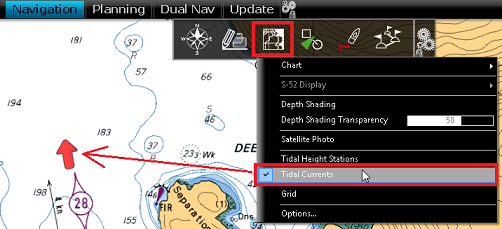
This will display arrows on the chart indicating the direction and overall speed of the current. Low current speeds are indicated in yellow. Orange or red colors indicate high speed currents.
TIP: The Tidal Current icon size can be adjusted from the Plotter Display Options.
IMPORTANT: Oceanic Currents (that are downloaded with Weather Forecast) are displayed in blue, while Tidal Currents (integrated in the software) are displayed in yellow-red. Oceanic Currents (blue arrow) can be turned ON or OFF from the Weather button located in the Ribbon. Please refer to Displaying Weather Data for more information.
If you put your cursor over a current icon or click on it, a tooltip indicating the Speed and Direction will appear.
IMPORTANT: All tidal current prediction times in the Navigation WorkSpace are adjusted for the local time currently selected on your computer. Make sure that your computer is set at the correct time and that the local time zone is properly selected for your area. To change the computer's time zone or daylight savings time setting, use the "Date and Time" option in the Windows Control Panel.
Displaying the Tidal Current Graph
To display a Tidal Current Graph, right click on a Tide icon and select "Open Current Graph" (or double click on the current icon):
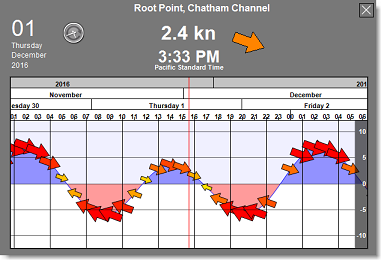
To change the time, you can drag the graph with your mouse, use the scroll wheel or use the right/left arrow of your keyboard.
Tips: To scroll the graph over a long time period, you can put your cursor over the day or month on the time bar and drag from this location. This will increase the scrolling speed.
To set the time of the graph back to the current time, click on the clock button: ![]()
Note: If you open the Current Graph from the Planning WorkSpace, the time of the graph is initialized to the same time selected in the timeline of the WorkSpace.