Displaying Weather Data
Displaying Graphically
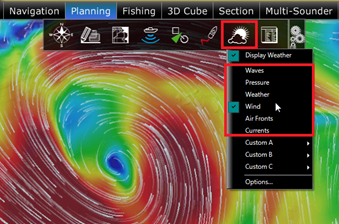
When you download a Weather File from the Update WorkSpace, TimeZero automatically loads the data for you. You just have to select the "Planning" WorkSpace, click on the "Weather" button in the Ribbons and select "Display Weather". TimeZero offers a new and innovative weather presentation using particle animation. It is now very easy to visualize the “flow” of weather and oceanographic conditions such as wind, currents and waves:
Note: When receiving the weather file by e-mail or from a third party provider, you first need to open the file in TimeZero. Please refer to the Opening a Weather File Chapter.
Once "Display Weather" is checked, you can choose from various display presets or select a custom display.
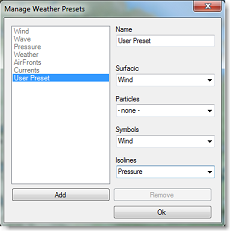
To create a custom display, select "Manage Weather Presets". A window will appear allowing you to create or modify existing user presets:
When the Wind is displayed using symbols (Weather Feather), the icon and color give you an estimation of the wind direction and wind speed. The size and number of feather indicates wind speed (add 5Kn for a small feather and 10Kn for a big feather):
| This icon and color a used if the wind is in between 0 and 2.5Kn | |
| This icon and color are used if the wind is in between 2.5 and 7.5Kn (one small feather) | |
| This icon and color are used if the wind is in between 7.5 and 12.5Kn (one big feather) | |
| This icon and color are used if the wind is in between 12.5 and 17.5Kn (one big feather and a small feather) |
When a weather data is displayed in color, a scale will be displayed on the lower left.
Displaying Numerical Value
The Weather information NavData can be used to display weather data using numerical values. It is displayed by default in the "Planning" NavData panel. This NavData displays weather condition under the cursor and is updated as you move the cursor over the weather data on the chart. If the "Weather Information" NavData is not displayed, click on the "+" icon on the top of the NavData panel and select "Weather Information":
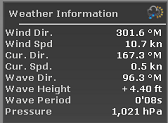
You can customize the weather data displayed in the NavData by right clicking on it.
Meteogram
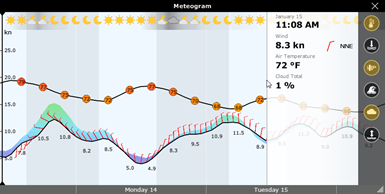
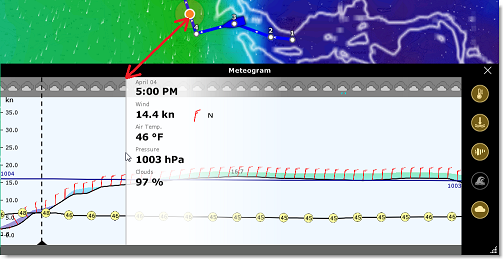
A “Meteogram” window can be opened by right clicking anywhere on the chart and selecting "Show Meteogram". The Meteogram allows to see a graphical presentation of one or multiple meteorological variables with respect to time at a particular location. If you click and hold the cursor inside the Meteogram window, numerical values will be displayed at the cursor position:
TIPS: You can change the scale of the Meteogram with the scroll wheel.
The Meteogram can be very useful to see the evolution of weather at a specific point (represented by the orange dot on the chart) and determining the best departure or arrival time. Note that you can drag the orange dot on the chart to change the Meteogram location and see the change applied in the window in real time.
The Meteogram can also be displayed along a route by right clicking on a route. The route projected speed and ETA will be used to show the various conditions that you will encounter along the journey. As you move your cursor over the Meteogram, you will see the orange dot move along the route to indicate the location of the weather forecast:
Weather Info (Source and Run date)
If you would like to know the weather validity (run date) or weather source, you can right click anywhere on the chart (when the weather is displayed) and select "Weather Information":
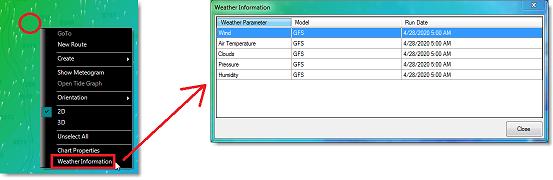
A window will appear listing all the weather parameters available at that location with their corresponding model and run date.
Weather Type and Coverage
The following Weather Data is available from the free Weather Service:
-
Wind: This data contains wind speed and wind direction forecast and is available globally (90°N/90°S/0°- 360°). The wind direction is given by the angle of "where the wind is coming from".
-
Air Temperature: This data contains the Air Temperature forecast and is available globally (90°N/90°S/0°- 360°).
-
Pressure: This data contains atmospheric pressure forecast at sea level and is available globally (90°N/90°S/0°- 360°).
-
Clouds & Rain: This data contains the Cloud Coverage and Rain forecast and is available globally (90°N/90°S/0°- 360°).
-
Humidity: This data contains the humidity forecast and is available globally (90°N/90°S/0°- 360°).
-
Wave: This data contains Wave Height and Wave Direction forecast and is available only on open oceans (excluding Great Lakes and Mediterranean) in between 78°N and 78°S (0°- 360°). The wave direction is given by the angle of "where the wave is going to".
-
Current: This data contains Oceanic Currents Speed and Direction at the time it was requested (one observation). This data has limited availability (47.04°N/78, 64°S & 0°- 360°). The current direction is given by the angle of "where the current is going to".
Note that the Premium Ocean-O Service offers multi-layer currents (current data available at multiple depth) as well as up to 10 days forecast. -
Sea Surface Temperature: This data contains the Sea Surface Temperature at the time it was requested (one observation). This data is available in between 65°N and 60°S (0°- 360°).
Note that the Premium Ocean-O Service offers higher resolution Sea Surface Temperature (8 times more accurate) and an alternate model. The Premium Ocean-O Service also offers multi-layer sea water temperature (temperature data available at multiple depth) as well as up to 10 days forecast. -
Sea Surface Height: This data contains the Altimetry at the time it was requested (one observation). This data is the ocean height anomaly from average sea level. This data is available in between 60°N and 60°S (0°- 360°)
-
Chlorophyll: This data contains the Chlorophyll concentration at the time it was requested (one observation). This data is available in between 52°N and 50°S (0°- 360°)
Note: The Premium Ocean-O Service offers additional high resolution and multi-layer data (FSLE, Thermocline, Salinity, Oxygen, Ph, Sea Ice etc...)