Using PBG
The "PBG Module" needs to be unlocked to access these features
To enable or disable PBG (enable or disable the depth logging), click on the "PBG" button in the ToolBar:

When the depth data is being recorded, the "PBG" Button turns yellow:

To verify that depth points are being recorded, you can turn ON the "PBG Points" from the "PBG" button located in the ribbon at the top of your screen. When the boat is moving and when depth is being received from your depth sounder, you should see small red points that are dropped every second behind your boat. Note that in order to see the PBG points, you may have to zoom in on the chart:
Note: PBG points are displayed on the User 3D Database and Imported 3D Database only.
Note: If PBG does not seem to work, make sure that the software receives a good position and depth. Double check also that the Status Bar does not display any message in yellow (at the very top of your screen) regarding a depth filter that could prevent the data from being recorded.
Depth Shading
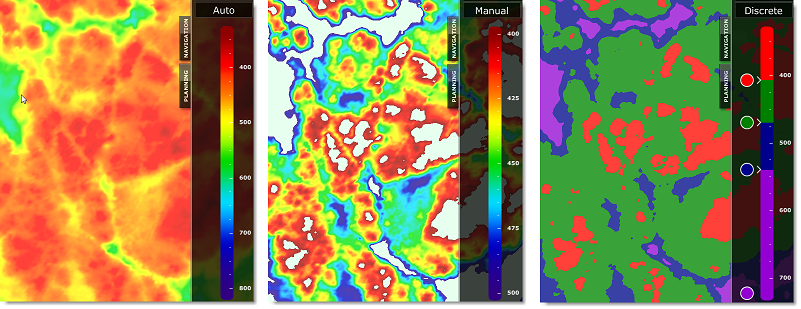
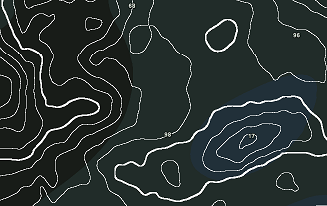
The Depth Shading allows to display color according to depth. Three modes can be selected:
-
Auto: In this mode, TimeZero scans for the deepest and shallowest point on the screen and automatically adjusts the upper and lower boundary so that your entire screen is always filled with color. This mode is useful to have a relative idea of where the shallow and deep areas are located. However, since the scale continuously changes as you scroll the chart, this mode is not good if you want to focus on absolute depth value.
-
Manual: In this mode, the minimum (red) and maximum (blue) depth values is adjusted manually. If an area containing depth points falls outside the range (defined by the minimum and maximum values), it will not be colored. This mode is useful if you want to highlight on the chart a specific depth range (for example when you are interested seeing all areas in between 100 and 150 meters). In between the minimum and maximum value a continuous gradient is used. The gradient that TimeZero uses can be selected by right clicking on the color scale.
-
Discrete: In this mode, you also select the minimum and maximum depth values, but you also select the color that will be used in between. This mode is very useful when you want to use specific color for specific depth range (for example, use red for areas unsafe for navigation, then orange for areas safe for navigation but not interesting for fishing, then green for areas that are good for fishing and finally blue for area that are too deep). In "Discrete" mode, color can be added by double clicking on the color scale and edited or removed by right clicking on a color circle.
The example below shows the same areas in Auto mode, Manual mode, and Discrete mode:
To display and adjust the depth shading mode, it is recommended to use the Fishing WorkSpace.
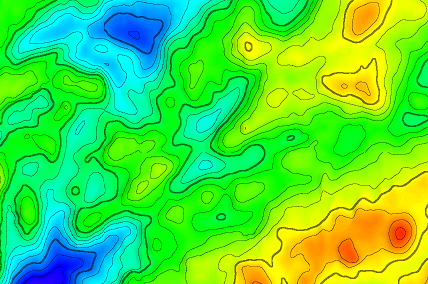
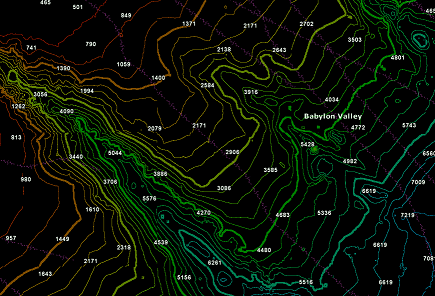
Depth Contour Lines
Depth Contour Lines generated using the 3D database can be displayed in TimeZero from the "Chart" button located in the Ribbon. An innovative GPU algorithm allows a large number of contour lines to be drawn on the screen while maintaining the “TimeZero” performance (fast chart redrawing in 2D or 3D).
The contour lines can be set in "Automatic" or "Manual" mode:
Automatic Mode
In automatic mode, TimeZero automatically adjusts the contour line interval based upon your density selection, slope and chart scale. As you zoom in/out or pan the chart, TimeZero will automatically adjust the contour line interval so that an appropriate amount of contour line is displayed on screen. This mode is perfect if you just want to have an idea of the relative slope for the area displayed on screen. However, if you prefer TimeZero to display a contour line based on a fixed interval, the manual mode should be used.
Manual Mode
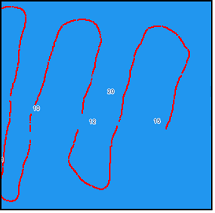
In manual mode, the contour line interval is manually fixed. In addition a "highlight" can be setup to display a bold contour line at a fixed frequency. In the example below, the interval has been manually set to 15 feet with a highlight frequency of 5 lines. There are 4 thin contour lines in between two bold contour lines:
TIPS: You can select "Inverse Chart Palette in Day mode" to invert the chart color scale. In that case, the contour lines will be displayed in white on the screen:
Contour Lines Color
When the depth shading is not displayed, the contour lines will be automatically displayed in color using the same scale and mode as the depth shading:.
Note: The contour lines will automatically revert to black when the depth shading is displayed, even if the option is checked. This prevents the contour lines from "disappearing" when using the same color as its background.
Contour Lines Coverage
By default, contour lines are only displayed on the same depth range (min/max) as the depth shading. If you want to display the contour lines everywhere, it is possible to uncheck "Restrict Contour Line to Depth Shading Range" from the Plotter Display Options or by right clicking on the Contour Lines button of the Fishing WorkSpace.
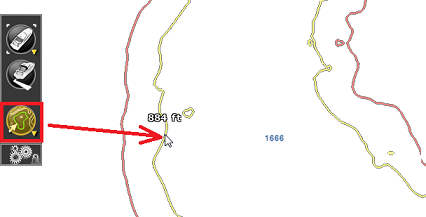
Contour Line Tool
TimeZero allows you to create two custom contour lines (a red and a green contour line) by using the cursor with the "Contour Line" tool selected. This can be useful to highlight on the chart shallow water or to mark a boundary in between two depth values.
Click on the "Configure Tools" button at the bottom of the ToolBar on the left side of the screen and make sure that the "Contour Line" tool is added to the Toolbar configuration:
![]()
When this tool is selected, a temporary yellow contour line is drawn under the cursor with a depth label. This allows you to move the cursor over the chart and position the contour line to the desired depth. Left click on the chart to drop the contour line:
The contour line will be either drawn in green or in red according to the tool that has been selected. To change the tool from the red contour line to the green contour line, right click on the tool and select the corresponding color. Note that only two contour lines can be created with this tool. If you drop a second contour line of the same color, it will replace the previous one.
To delete the red and green contour line, just double left click on the Contour Line tool icon in the ToolBar.
Note: The red and green contour lines that have been drawn with the Contour Line tool appear on the chart even if "Depth Contour Lines" is not selected from the "Chart" Ribbon.
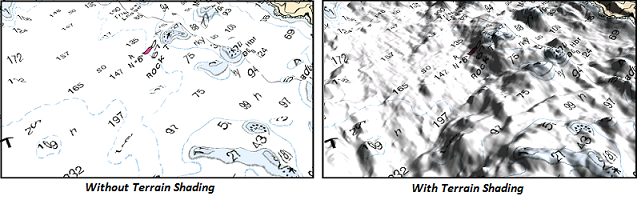
Terrain Shading
The Terrain shading highlight the relief on the chart and is available under the “chart” button located on the Ribbon or from the Fishing WorkSpace. The shading level can be adjusted from the same location. This feature is especially useful in 3D mode when the charts are uniform (same color), making the 3D relief more visible: