Selecting Charts & Overlays
TimeZero's powerful graphics engine adds new chart presentation options to the conventional method of electronic chart plotting. TimeZero can display vector or raster charts and merge them with satellite pictures and depth shading. With 3D data and our Satellite PhotoFusion rendering, satellite imagery blends with critical chart data in an easy, useful way that greatly enhances situational awareness.
Selecting Charts
Click on the Chart button in the Ribbon to display and select the various options:

Note that the various chart selection options listed below will vary according to the charts that have been installed and unlocked on your computer.
-
TZ Vector: Select this option to display the new Mapmedia TZ Maps vector charts.
-
TZ Raster: Select this option to display the new Mapmedia TZ Maps raster charts.
-
TZ BathyVision: Select this option to display the new Mapmedia TZ Maps Fishing Charts.
-
MM3D Auto: Select this option if you want TimeZero to automatically pick the best MM3D chart source according to the area
Note: By default, TimeZero will try to use a Vector chart in Auto mode. However, if you have installed and prefer Raster charts, you can switch the "Chart Priority in Auto Mode" to "Raster" from the Plotter Display Options
-
MM3D S-57: Select this option to display Vector Charts from Hydrographic Offices (NOAA) compiled in MM3D format
-
MM3D C-Map: Select this option to display Mapmedia mm3d C-Map Vector charts
-
MM3D Raster: Select this option to display Raster Charts from Hydrographic Offices (NOAA, SHOM, UKHO,...)
-
ENC: Select this option to display S57 (ENC) or S63 (Encrypted ENC) charts that have been imported
Note: If a chart type is missing from the selection, it means that you have not installed that type of chart yet.
Chart Property
Source, issue date and other chart information can be displayed by right clicking on the chart and selecting “Chart Properties” (for MM3D) or "Chart Object Properties" (for TZ Maps):

Satellite Photos
Satellite pictures can be fused with raster or vector charts by a method called PhotoFusion. Land areas are completely opaque, so that these areas are displayed as high-resolution satellite photos on the chart. As the depth increases, the satellite photography becomes more transparent so that the shallows are displayed along with the chart information. As the deeper water begins, the satellite picture disappears, leaving the raster or vector chart. High-resolution satellite photography enables the user to easily identify the seabed classification as sand, rock, coral or other obstructions.
To enable the PhotoFusion overlay, select "Satellite Photo" from the Chart button.
Note: PhotoFusion automatically adjusts the transparency of the Satellite Photo, however, it is possible to manually offset the transparency (make it more or less transparent) using the "PhotoFusion Transparency Offset" setting available in the Plotter Display Menu.
Depth Shading
A depth color scale can be applied to raster or any type of vector charts. This unique feature allows you to view water depths at-a-glance with vibrant colors. To enable the Depth Shading overlay, select "Depth Shading" from the Chart button. The transparency levels can be adjusted from the same location so that the chart data is visible beneath the color shading.
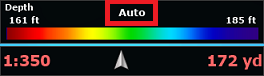
By default, the color scale is set automatically (TimeZero scans for the deepest and shallowest point on the screen and automatically adjusts the upper and lower boundary). You can disable the Automatic mode by clicking on "Auto".
In Manual mode, you can adjust the lower and upper boundaries by moving the cursor over one of the depth values and using the mouse wheel to change it. You can also adjust the lower and upper boundaries from the Plotter Display under Depth Shading.
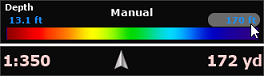
Tips: If you put the cursor over the color scale and use the mouse wheel (in manual mode), it will change both the upper and lower boundary at the same time (span).
If you have the PBG module unlocked, the discrete depth shading can be enabled to provide total control over the color and associated depth value. Please refer to the Fishing WorkSpace chapter.
Other Overlays
The Chart button in the Ribbons allows the user to display various additional overlays:
-
Select "Tidal Height Stations" to display the Tidal Gauges on the Charts (refer to Tides for more information).
-
Select "Tidal Currents" to display Currents Arrows on the Charts (refer to Tidal Currents for more information).
-
Select "Grid" to display a Lat/Lon or TD (loran) grid on the Charts.
Note: When the Grid is set to TD or Loran, it will only appear at lower zoom level